


Otaviano Canuto, World Bank Group: Macroeconomics and Stagnation – Keynesian-Schumpeterian Wars
 Policy makers in the advanced economies at the core of the global financial crisis can make the claim that they prevented a new “Great Depression”. However, recovery since the outbreak of the crisis more than five years ago has been sluggish and feeble. Since these macroeconomic outcomes have to some extent been shaped by policy mixes adopted in those economies in response to the crisis, the appropriateness of those policy choices is a question worth revisiting. This is particularly the case as one considers the hypothesis that a long-run trend toward stagnation may have already been at play during the pre-crisis period, even if temporarily countervailed by pervasive asset price booms.
On the other hand, there is a core divergence among those “Keynesian” and “Schumpeterian” economists who have proposed such stagnation hypotheses. While both groups agree that asset bubbles momentarily offset underlying stagnation trends before the crisis and that the recovery has been subpar, they point to different underlying factors for continued anemic levels of growth. “Keynesians” argue from the “demand side” and believe that fiscal policies have been far too restrictive, with too much emphasis on monetary policies recently, whereas “Schumpeterians” believe that the necessary force of creative destruction has not been allowed to fully take place for a long time now.
Actual GDP has lagged behind its potential along the recovery
Chart 1– from Davies (2013) – depicts several key features of the ongoing recovery in advanced economies. First, the aggregate growth trend exhibited prior to the crisis is no longer there, either because it was not really sustainable in the long run and/or as a legacy of the crisis. Second, a new “Great Depression” has been avoided but actual GDP has remained subpar relative to the latest IMF/OECD estimates for potential output. Finally, despite the possibility of catching-up with potential GDP in two years, as outlined in the central GDP projection, such an outcome remains subject to policymakers properly calibrating their responses to a wide range of idiosyncratic challenges ahead (Canuto, 2014).
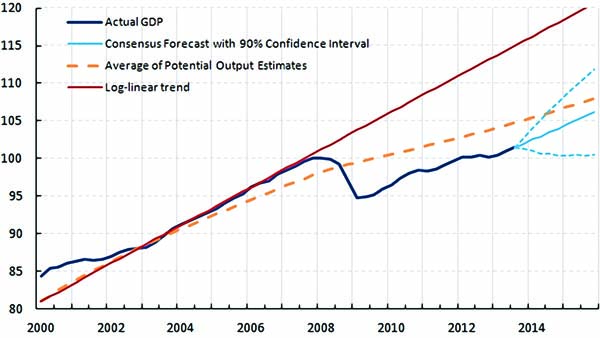
Chart 1: Aggregate G4 (US, Euro Area, Japan, UK) GDP, Potential and Trend.
Note: Potential Output is Average of IMF and OECD estimates. PPP weighted average. Source: Fulcrum Asset Management.
As shown by Kose et al (2013), the ongoing recovery in advanced economies has been sluggish and fragile when compared to the three previous ones. While real GDP per capita returned to positive trajectories soon after previous temporary downturns, this time it not only started decelerating well prior to the global recession year (2009), but has not yet fully recovered its peak levels.
“While both groups agree that asset bubbles momentarily offset underlying stagnation trends before the crisis and that the recovery has been subpar, they point to different underlying factors for continued anaemic levels of growth.”
At first glance, this is not surprising, given the nature of the factors underlying the crisis: the pervasiveness and magnitude of asset booms and busts; design flaws of the Eurozone fully revealed as the crisis unfolded; the degree of synchronization of recessions; policy uncertainty associated with a loss of confidence on the sufficiency of established policy blueprints; and so on. Moreover, any such transition from a previously booming economy to a “new normal” would necessarily entail a significant reallocation of resources, with creation/destruction of jobs and productive assets. As remarked by Rajan (2013):
“(…) the bust that follows years of a debt-fueled boom leaves behind an economy that supplies too much of the wrong kind of good relative to the changed demand. Unlike a normal cyclical recession, in which demand falls across the board and recovery requires merely rehiring laid-off workers to resume their old jobs, economic recovery following a lending bust typically requires workers to move across industries and to new locations.”
On the other hand, gauging by the size and persistence of the gap between actual and potential GDPs exhibited in Chart 1, one may question whether such a transition might have been made faster with appropriate macroeconomic policies. After all, while economists often assume that, no matter where potential GDP might be, actual GDP will eventually move to it, convergence can occur in the reverse direction. Losses associated with prolonged periods of significant output gaps – e.g., labor de-skilling, foregone R&D efforts, and resource idleness – then become permanent.
The crisis response has been single-handedly based on monetary policy
Kose et al (2013) point out how the recovery in advanced economies may have reflected peculiarities of the policy mix adopted as responses to the recent economic downturn, as compared to previous experiences. While both fiscal and monetary policies have been implemented in a countercyclical direction in the past, that has not been the case this time.
Monetary policy has been extremely accommodative. As policy interest rates approached the bottom – the lower zero bound – central banks went so far as to expand their balance sheets, in conjunction with other unconventional monetary policies (Canuto, 2013a). Chart 2 illustrates that by matching short-term interest rates during previous and current (the “Great Recession”) experiences.
![Chart 2: [Left - Advanced Countries. Right - Emerging Market Countries. Blue line - Average of previous recessions. Red line - Recovery from Great Recession.] Short-term interest rate during global recessions and recoveries (percent). Note: Zero is the time of the global recession year. Each line shows the PPP-weighted average of the countries in the respective group. Source: Kose et al (2013)](https://cfi.co/wp-content/uploads/2014/05/2.jpg)
Chart 2: [Left – Advanced Countries. Right – Emerging Market Countries. Blue line – Average of previous recessions. Red line – Recovery from Great Recession.] Short-term interest rate during global recessions and recoveries (percent). Note: Zero is the time of the global recession year. Each line shows the PPP-weighted average of the countries in the respective group. Source: Kose et al (2013)
Conversely, while previous recovery experiences were supported by the expansion of public spending, fiscal policy has this time moved in the opposite direction (Chart 3). The fiscal stimulus implemented in the US at the outset of the downturn was reversed not long after, followed by fiscal contraction. In the Eurozone, in turn, fiscal austerity policies were implemented as financial havoc morphed into fiscal unsustainability of its crisis-ridden members. Austerity has also been favored in the UK.
![Chart 3: [Left - Advanced Countries. Right - Emerging Markets. Blue line - Average of previous recoveries. Red line - Recovery from Great Recession.] Real primary expenditure (index, PPP weighted). Notes: Dashed lines denote WEO forecasts. Figures are indexed to 100 in the year before global recession. Zero is the time of the global recession year. Each line shows the PPP-weighted average of the countries in the respective group. Source: Kose et al (2013)](https://cfi.co/wp-content/uploads/2014/05/3.jpg)
Chart 3: [Left – Advanced Countries. Right – Emerging Markets. Blue line – Average of previous recoveries. Red line – Recovery from Great Recession.] Real primary expenditure (index, PPP weighted). Notes: Dashed lines denote WEO forecasts. Figures are indexed to 100 in the year before global recession. Zero is the time of the global recession year. Each line shows the PPP-weighted average of the countries in the respective group. Source: Kose et al (2013)
Why has the fiscal and monetary policy mix been so different? On the fiscal policy side, as shown by Kose et al (2013), public debt levels in advanced economies were much higher than in the past when the macroeconomic downturn took place. Public deficit levels had soared in the run-up to the recession, given the scale of financial support measures and substantial revenue losses. However, one may also say that a policy option for austerity was exercised. In the cases of the US and UK, financial markets were not imposing any substantial short-term fiscal retrenchment – especially if medium-to-long-term structural adjustment plans were to be announced. In the Eurozone, in turn, the intensity of fiscal adjustment in crisis-ridden members could have conceivably been lower provided that a correspondingly higher financial support from outside had been made available.
Unconventional monetary policies, in turn, came out of the urgency of halting potentially catastrophic processes of debt deflation and bank-credit freezes that threatened to transform solvent-but-illiquid balance sheets into insolvent ones. In the case of the Eurozone, such risks of financial meltdown were compounded by negative feedback loops between banks’ portfolios and rising risk premiums associated with crisis-ridden national public debts.
Very loose monetary policies smoothed the process of private-sector balance-sheet deleveraging by keeping yields at low levels and propping up asset values. In the Eurozone, risk premiums abated after the European Central Bank pledge to do “what it takes” to keep currency convertibility.
The phasing out of unconventional policies has been protracted as a reflection of the sluggishness and feebleness of the macroeconomic recovery and the absence of fiscal stimulus as an alternative. In the Eurozone, the debt overhang is still salient and balance-sheet deleveraging still has some way to go, but certainly in the case of the US, where debt deleveraging has already been substantial, fears regarding consequences of the unwinding of quantitative easing have made it a measured and paced process.
Can one point out the single-handed reliance on monetary policy to counter downturn as a factor underlying actual GDP tracking behind potential levels? After all, most analysts attribute an asymmetric capacity to monetary policy in economic downturns: the ability to countervail risks of asset-debt deflation is not accompanied by an equivalently strong capacity to induce agents to invest in new productive assets. As the saying goes, “one can pull a string, not push it!” Furthermore, after a certain point, ultra-loose monetary policy would only lead to a repeat of the bubble-blowing process seen before the crisis.
In this sense, countercyclical moves by policy makers might have reduced the length and size of the observed output gap had fiscal policy operated as a countercyclical tool complementary to monetary policy. However, as we approach in the following, this issue is far from being settled.
What if a “secular stagnation” trend has been at play? Which one?
The role of asset bubbles pulling up the pre-crisis growth trajectory depicted in Chart 1 is now widely acknowledged. In the case of the US:
“(…) the liquidity-generating machine inflated US asset values and fed the exuberant growth of US household spending. US consumers have accounted for more than one-third of the growth in global private consumption since 1990. Increasingly, their spending was made possible by the wealth effect generated by the rising prices of housing and household financial assets and stocks, whose values were in turn expected to more than outstrip those of household debt. It was this upswing in consumption by US households, and others as debt-based consumers-of-last-resort in the global economy that essentially made possible the extraordinary structural transformation and productivity increases experienced by some manufacturing exporters and commodity producers among developing economies.” (Canuto, 2009)
A similar bubble-led growth process could be found inside the Eurozone, starting with the downward convergence of perceived risks and interest rates throughout the zone after the introduction of the new common currency. Today’s countries under stress were able to sustain domestic absorption much above domestic production capacities for a long period, easily financing the difference because of fallen-from-heaven domestic asset value appreciation. The underestimation of fiscal risks can also be seen as a manifestation of such euphoria.
Asset-price dynamics has now been mainstreamed as an important subject to be addressed by policy makers. Macroprudential policies are now a component of the macroeconomic stabilization toolkit (Canuto, 2013b).
However, enhancing the policy framework by revamping financial regulation and supervision and combining monetary and prudential policies in order to ensure both financial and macroeconomic stability may not be enough if some underlying secular trend of stagnation is at play. If the pre-crisis growth trend depicted in Chart 1 was inextricably dependent on the overspending induced by the financial frenzy – credit and house bubbles – then running its course, avoiding future asset price booms and busts might simply lead to stability around low growth rates.
Such a view underlies the possibility of a “secular stagnation” trend as discussed by economists like Krugman (2013) and Summers (2013):
“Manifestly unsustainable bubbles and loosening of credit standards during the middle of the past decade, along with very easy money, were sufficient to drive only moderate economic growth. (…) short-term interest rates are severely constrained by the zero lower bound: real rates may not be able to fall far enough to spur enough investment to lead to full employment.” Summers (2013)
They and other – say, “Keynesian” – economists have suggested an array of possible causes for the US economy and others to display a propensity of aggregate demand shortfalls, in the sense that, as a result of structural conditions, aggregate spending would be enough to ensure full employment and use of potential output capacity only in the presence of negative real interest rates. Such an “investment drought” – or, as a flipside, a “savings glut” as measured by levels of non-consumption expenditures required to sustain income at full employment – could be seen as underlying the evolution depicted in Chart 4, obtained from Fatas (2013).
![Chart 4: [Dark Blue - Private Nonresidential Investments (% of GDP). Light Blue - Real Interest Rate.] US - Private Nonresidential Investment and Real Interest Rates. Source: Fatas (2013).](https://cfi.co/wp-content/uploads/2014/05/4.jpg)
Chart 4: [Dark Blue – Private Nonresidential Investments (% of GDP). Light Blue – Real Interest Rate.] US – Private Nonresidential Investment and Real Interest Rates. Source: Fatas (2013).
Beyond the legacies of the crisis – higher risk aversion, increased savings by states and consumers, increased costs of financial intermediation and major debt overhangs – several long-standing factors could be pointed out as dampening investment. Among them, I would single out two as most significant:
First, rising income concentration – rising shares of income accruing to capital and the very wealthy – would be leading to overall under-consumption, only occasionally countervailed with unsustainable over-indebtedness by the poor. Second, features of technology evolution might also be contributing to an investment drought. Steep declines in the costs of durable goods – especially those associated with information and communication technology and/or outsourcing – would mean less spending levels associated with investment plans out of corporate savings. Furthermore, the trajectories of technological evolution currently unfolding would not carry an array of high-return investment opportunities comparable to past ones.
Summers (2014) argues that:
“(…) our economy is held back by lack of demand rather than lack of supply. Increasing capacity to produce will not translate into increased output unless there is more demand for goods and services.” He strongly recommends establishing “a commitment to raising the level of demand at any given level of interest rates through policies that restore a situation where reasonable growth and reasonable interest rates can coincide.”
It follows from this view that the policy mix that has prevailed since the aftermath of the crisis has been inappropriate. Instead of relying single-handedly on ultra-loose monetary policy, public spending – on infrastructure, energy and others – should be rescued from the retrenchment to which it has been submitted. By the same token, pro-active public policies to ignite private investment spending should also be implemented.
On the other side of the debate, there are those – say, “Schumpeterian” – economists who have offered supply-side based hypotheses of a long-run stagnation trend already in course for some time. Like Joseph A. Schumpeter, they lay emphasis on growth as a process of “creative destruction” in which obsolete forms of resource allocation and wealth – jobs, fixed-capital assets, technologies, and balance sheets – are replaced by higher-value ones. Although accepting an eventual role of monetary policies in avoiding systemic financial meltdowns, they tend – also like Schumpeter – to be more skeptical of fiscal or other types of countercyclical stimulus if these are designed in ways that retard the process of creative destruction. As for the post-crisis policy mix, even if it is acknowledged that fiscal policy may have moved precociously to the contractionary side, ultimately public policy action to prop up aggregate demand is not considered to be a key component of the fight against stagnation: “If you are postulating a stagnation across the longer run, ultimately it will have to boil down to supply side deficiencies.”(Cowen, 2013). The evolution of declining investments in tandem with lower interest rates shown in Chart 4 would be seen as stemming from disadvantageous rates of return not related to the pace of aggregate demand expansion.
Technological evolution leading to stagnation trends has been for some time now put forth as a hypothesis by Gordon (2014). Nevertheless, his arguments are about low productivity-raising features of current technological trajectories rather than on their supposedly dampening implications regarding aggregate demand.
Cowen (2011) has in turn approached stagnation as an outcome of the exhaustion of a significant set of “low-hanging fruits” reaped in recent history, namely one-off supply-side opportunities associated with post-war reconstruction; trade opening; diffusion of new technologies in power, transport, and communications; educational attainments and others. Other supply-side possibilities of stagnation recently suggested are associated with features of resource allocation – e.g. over-sizing of financial activities, as discussed by Canuto (2013c).
As outlined by Rajan (2012), such line of proposition about stagnation trends suggests that:
“(…) the advanced countries’ pre-crisis GDP was unsustainable, bolstered by borrowing and unproductive make-work jobs. More borrowed growth – the Keynesian formula – may create the illusion of normalcy, and may be useful in the immediate aftermath of a deep crisis to calm a panic, but it is no solution to a fundamental growth problem. If this diagnosis is correct, advanced countries need to focus on reviving innovation and productivity growth over the medium term, and on realigning welfare promises with revenue capacity, while alleviating the pain of the truly destitute in the short run.”
For the sake of conclusion
Keynesian and Schumpeterian hypotheses of stagnation trends are based on non-directly observable factors. Therefore, the struggle for hearts and minds of public opinion and policy makers will likely remain unsettled. Nevertheless, let us conclude by offering two broad takeaways:
First, regardless of the size of public outlays, public action and spending should be both designed in ways that “maximize the bang for the buck” in terms of overcoming obstacles to the process of creative destruction. Take the case of Japan: the third arrow of Abenomics – on structural reforms of the services sectors and others – will be a condition for successful results from its fiscal and monetary arrows. In the Eurozone, quicker action to restructure/consolidate “zombie” balance sheets and companies, in line with a more pro-active stance taken by monetary and financial authorities, should also hasten the path out of the current stagnation.
Second, regardless of whether advanced economies are indeed facing either demand- or supply-side stagnation trends, a major bet for the global economy to escape remains on the developing world’s economic transformation as a source of growth (Canuto, 2011). However, for that to happen, developing countries themselves will also need to pursue their own country-specific agendas of structural reform (Canuto, 2013d).
About the Author
 Otaviano Canuto is Senior Advisor on BRICS Economies in the Development Economics Department, World Bank, a new position established by President Kim to bring a fresh research focus to this increasingly critical area. He previously served as the Bank’s Vice President and Head of the Poverty Reduction Network (PREM), a division of more than 700 economists and other professionals working on economic policy, poverty reduction, gender equality and analytic work for client countries. He also served as an Executive Director of the Board of the World Bank from 2004-2007. Outside of the Bank he has held leadership positions at the Inter-American Development Bank where he was Vice President for Countries, and for the Government of Brazil where he was Secretary for International Affairs at the Ministry of Finance. He also has an extensive academic background, serving as Professor of Economics at the University of São Paulo and University of Campinas (UNICAMP) in Brazil.
References
Canuto, O., 2009. The developing world in a post-bubble economy, Economonitor, April 9.
Canuto, O., 2011. Risky growth engines, Project Syndicate, January 21.
Canuto, O., 2013a. Emerging markets and the unwinding of quantitative easing, Capital Finance International, October 16.
Canuto, O., 2013b. Walking on the wild side – monetary policy and prudential regulation, Capital Finance International, December 16.
Canuto, O., 2013c. Finance as an economic cholesterol, Huffington Post, September 3.
Canuto, O., 2013d. Lost in transition, Project Syndicate, December 2.
Canuto, O. 2014. Calibrating 2014, Huffington Post, January 2.
Cowen, T., 2011. The great stagnation: how America ate all the low-hanging fruit of modern history, got sick, and will (eventually) feel better, New York: Dutton Publishing, Penguin.
Cowen, T., 2013. Are real rates of return negative? Is the ‘natural’ rate of return negative?, Marginal Revolution, November 18.
Davies, G., 2013. The implications of secular stagnation, Financial Times, November 17.
Fatás, A., 2013. Bubbles, interest rates and full employment, Antonio Fatás on the Global Economy, November 19.
Gordon, R.J., 2014. The demise of U.S. economic growth: restatement, rebuttal, and reflections, NBER Working Paper No. 19895, February.
Kose, M.A., Loungani, P., and Terrones, M.E., 2013. Why is this global recovery different?, VoxEU, April 18.
Krugman, P. 2013. Bubbles, regulation, and secular stagnation, The Conscience of a Liberal, New York Times, September 25.
Rajan, R., 2012. A crisis in two narratives, Project Syndicate, January 27.
Rajan, R., 2013. Why stimulus has failed, Project Syndicate, January 22.
Summers, L., 2013. Economic stagnation is not our fate — unless we let it be, Washington Post, December 18.
Summers, L., 2014. Strategies for sustainable growth, Washington Post, January 5.
You may have an interest in also reading…

Samir Barua and 36 Years at IIM-A
Prof. Samir Barua’s tenure as Director of Indian Institute of Management, Ahmedabad will have ended by the time you read

Bullish on Chile: Elections Prompt New Thinking
Copper is set for a price rebound. Manufacturing output in China is up more than analysts predicted and that country’s

Bangladesh Receives $600 Million to Improve Rural Electricity Supply
The Government of Bangladesh today signed a $600 million credit to improve the quality of electricity supply for 25 million
