







































































The Cost Curve Did Not Reach the Balance Sheet: Reading Energy’s Latest Marks
Across energy filings struck between March 2025 and June 2026, the largest write-downs sat on low-carbon assets and the only write-backs booked in the current periods sat on merchant gas. Not one of the impairment notes gives the cost of the technology as the reason. What they give instead is a discount rate, a contract, a policy, a demand forecast, or nothing at all.
What bp booked, and what it did not
bp published second-quarter and half-year 2026 results on 4 August. The segment note for gas and low carbon energy records “a net impairment charge of $680 million and $525 million respectively, primarily related to the group’s transition businesses”, the quarter first and the half year second. Two smaller marks follow, $107m in oil production and operations and $101m in customers and products. The three add exactly to bp’s net impairment charge for the quarter, $888m; the half-year charge is $1,248m. So one segment carries about three quarters of the quarter’s impairments and two fifths of the half’s. How much is transition businesses, bp does not say; “primarily” is as far as it goes.
The comparatives cut both ways. The segment charge is up on the quarter from $431m a year earlier and down on the half from $746m, and group impairments fell in both periods.
Now the number that is not there. bp revised the price assumptions behind its value-in-use tests, lifting Brent to $80 a barrel from $70 and cutting Henry Hub gas to $3.34 per million British thermal units, then states that “No material impairment or reversal of impairment arose in the second quarter 2026 and half year 2026 interim periods as a result of the changes to these commodity price assumptions.” Prices did the work in the income statement, lifting underlying replacement cost profit to $5,732m from $2,353m a year earlier. They moved nothing material in the impairment note.
Meg O’Neill, in her first full quarter as chief executive, says it has been “marked by one of the most disrupted periods in the global energy market”. The disruption runs through every line of the income statement, and through the impairment note only where the assets have nothing to do with oil. bp’s 14 July trading statement had flagged “post-tax adjusting items relating to impairments of around $1.0 billion” in the same segment; that flag cannot be checked against results which publish no post-tax impairment total.
Two ways a number becomes a charge
The discount rate is the quieter of the two, and the arithmetic is indifferent to what the asset burns. bp discloses that “The post-tax discount rate used for value-in-use impairment testing of assets other than certain low carbon energy assets was maintained at 8%”. The carve-out is doing work. bp tests certain low carbon energy assets on some other basis, and this release does not say what.
The second channel gets less attention. Of Harbour Energy’s $365m net pre-tax impairment charge for 2025, “$41 million (2024: $174 million) was in respect of revisions to decommissioning estimates on mainly non-producing assets with no remaining book value”. Such a revision is normally offset against the asset, “unless the asset is fully depreciated, in which case the change in estimate is recognised directly within the income statement”. Once an asset has been written to nothing, the cost of retiring it drops straight through to profit. Harbour’s undiscounted provision stood at $10.5bn.
Four write-downs, three different reasons
The low-carbon marks do not share a cause, and grouping them by driver tells you more than adding them up.
Rate-driven. Ørsted’s first-quarter 2026 interim report records total impairment losses of DKK 1,369m against a net reversal of DKK 272m a year earlier, DKK 837m of it on Sunrise Wind. The note leads plainly on cause, before naming tariffs and tax credits as drivers too: “The impairment loss was driven by an increase in the long-dated US interest rate”, with DKK 1.2bn on US offshore projects and DKK 0.2bn on US onshore. Within the offshore total, Sunrise Wind carries DKK 837m and Revolution Wind DKK 260m. That move lifted weighted average cost of capital by “approximately 25 basis points across our US portfolio”. Nothing about the turbines changed. In the earlier quarter the mechanism ran backwards, on “a decrease in the long-dated US interest rate (DKK 1.5 billion)”.
Decision-driven. Shell’s second-quarter results of 30 July 2026 record “Impairments recognised in the second quarter 2026 of $629 million pre-tax ($545 million post-tax) principally relate to Renewables and Energy Solutions ($581 million)”, charges “principally triggered by portfolio choices regarding renewable generation assets in Asia and Europe”. bp’s transition charge belongs in the same column.
Demand- and policy-driven. Drax booked a “non-cash charge for impairments of £378 million” in its 2025 results, published on 26 February 2026. Its segment commentary reports the same events on bases of its own, two including related charges, so they do not sum to that headline: £198m in the Canadian pellet business, £138m on the paused Longview project, £48m on UK bioenergy with carbon capture and storage. The Canadian charge is put down to “a lower growth outlook for the global pellet market after 2027” and a “constrained Canadian fibre market”; on the UK project Drax cites “the current political environment and absence of an appropriate regulatory framework”. No rate appears anywhere in that explanation.
The other side of the ledger is smaller than it looks
Two figures in this run of accounts moved a carrying value upwards, and both sit on merchant gas. SSE’s results for the year to 31 March 2026 record “non-cash impairment reversals of £48.5m relating to operational Gas Storage assets and £29.4m relating to the carrying value of the Group’s investment in Triton Power”, a gas-fired flexibility business. Both carry a stated cause: SSE reviewed the storage assets “due to global commodity market volatility in the period prior to the Group’s balance sheet date”, and the Triton reversal followed “updates to projected running schedules and future market price assumptions”.
So the write-backs were not contracted. They were priced. Volatility raised the worth of a store and of a plant that earns when the system is short, and SSE marked both up on it. The same note carries £155.8m of charges against two mid-construction onshore wind farms, “following grid connection delays notified during the year”. Renewables impaired by a queue, gas written back by a price.
National Grid did not write anything back. Its total group regulated asset value and rate base reached £66,438m at 31 March 2026 against £59,473m a year earlier at constant currency, growth of 11.7 per cent that the company attributes to “Capital investment and RAV indexation”, struck excluding the year’s disposals. That is neither a reversal nor a revaluation. A regulated asset base grows because money went into it and because a formula indexed it, and the indexation is a policy instrument.
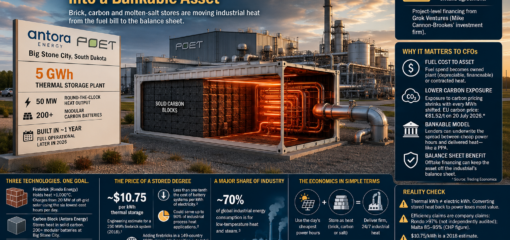
Storage is not a mark either. Gresham House Energy Storage Fund reported that “Contracted revenues more than doubled to £23.8mn in 2025 (FY24: £11.5mn)”, alongside floor agreements covering 939MW of its operational portfolio. That is a revenue line, evidence for the argument CFI.co has made before, that markets rather than mandates made renewable output dispatchable and that contracting turns a cheap hour into a bankable asset. It is not a carrying value.
The curve flattened for a financing reason
The cost curve is the obvious candidate for a run of low-carbon write-downs. No issuer here offers it as a reason, and the published cost data show why.
The International Renewable Energy Agency’s (IRENA) Renewable Power Generation Costs in 2025, published on 2 July 2026, reports that “In 2025, the global, weighted-average levelised cost of electricity (LCOE) for solar PV remained unchanged compared to 2024, at USD 44 per megawatt hour (MWh)”. IRENA is explicit about why: “solar PV installed costs fell by around 6% in 2025, yet the LCOE of this technology remained unchanged. This was because a higher cost of capital offset the cheaper equipment and systems.”
Equipment got cheaper; a higher cost of capital and slightly weaker capacity factors cancelled it out. The effect is not uniform, with onshore wind falling to USD 33/MWh and offshore wind to USD 78/MWh.
The thermal curve moved the other way, pushed by supply. The United States Energy Information Administration’s assumptions for its Annual Energy Outlook 2026 adopt a Brattle Group and Sargent & Lundy study for the PJM Interconnection, which found new gas plant costs up “significantly in recent years due to supply shortages and tight markets for both materials and labor for combustion turbines”. Against the agency’s 2024 inputs that is “about a 40% increase in simple-cycle turbine costs and a 20% increase in combined-cycle plant costs”. CFI.co argued in December that higher capital costs were pulling new gas upwards. The turbine order book is that mechanism with a name on it.
The case for reading these as verdicts
The strongest argument against the rate reading is that it flatters the assets. On this view the write-downs are what they look like: managements concluding that low-carbon returns do not clear their cost of capital, and saying so through the one channel that binds.
Parts of that hold. Shell attributes its charge to portfolio choices and Drax’s pellet write-down turns on a demand forecast. bp rules out the changes to its price assumptions as a source of material impairment, but the deck it revised is Brent and Henry Hub, and the assets behind the transition charge are not hydrocarbon assets. bp publishes a segment and no cause.
Ørsted looks at first like the sharpest evidence for it. Its first-quarter note discloses that if the weighted average cost of capital “had increased by 50 basis points in the impairment test of e.g. Revolution Wind as of 31 March 2026, the impairment loss would have been DKK 0.5 billion higher”, and that without the probability-weighted additional 10 per cent investment tax credit bonus credits the same test would have produced an impairment “DKK 1.3 billion higher”. Side by side, the policy assumption looks worth two and a half times the rate.
The two are not comparable, and the note says why. The tax credit assumption did not move: Ørsted states that “We have based our impairment tests on the assumption that our US projects would qualify for the 10 % ITC bonus credits”, carried at a 95 per cent probability weighting. The rate did move, by half the size of the stress set against it. Ørsted presents both figures as alternatives “performed with all other assumptions unchanged”, not as a ranking of causes. Halve the 50 basis point sensitivity to the 25 that occurred and it lands at DKK 0.25bn against the DKK 260m Ørsted booked on Revolution Wind. Its stated driver survives its own table; the larger number measures a world that did not arrive.
Rasmus Errboe, group president and chief executive, sets out in the same report where the company is going: “our focus going forward primarily will be on offshore wind in Europe and select markets in APAC.” That is a portfolio decision, and it will generate marks of its own.
So neither reading holds across the set. The discount rate is decisive in the clearest case and absent from most of the rest: portfolio choices at Shell, demand and a regulatory vacuum at Drax, reserves and field performance at Harbour, a contract at AES, commodity volatility at SSE and a grid queue in the same set of accounts. There is no single variable here and the filings do not pretend there is.
Refining, and a price that changed nothing
European refining had the opposite quarter. There are no marks in the quarter, and the margins are not close to last year’s. TotalEnergies published second-quarter results on 23 July. Its European refining margin marker came in at $13.5 a barrel against $4.7 a year earlier, and refining and chemicals adjusted net operating income at $1,800m against $389m. Patrick Pouyanné, chief executive, sets the quarter “in a high-price environment related to the Middle East conflict”, though the credit he claims is for the company’s “integrated model and portfolio diversification”.
The company supplies its own caveat, putting global refining margins at historically high levels “in an unprecedented context combining unavailability of Russian refining capacity, the disruption of the supply from the Middle East to Asian refineries and global inventories at historical lows”.
Two of those three are supply that went missing.
The crude side tells the same story at scale. Saudi Aramco reported on 4 August. Adjusted net income was $33.4bn for the second quarter, up 33 per cent, and $67.2bn for the half year. The average realised crude price is reported at about $108 a barrel against about $67 a year earlier.
Now set the treatments beside each other. Against a realised price of that order, bp put $10 a barrel on its Brent assumption and found no material impairment or reversal either way, on an estimate that “assumes that the ongoing supply disruptions resulting from geopolitical instability in the Middle East resolve before the year end 2026”. SSE, on the other side of the same commodity story, wrote £48.5m back on volatility. A 25 basis point rate move went through Ørsted’s income statement at once, at DKK 1.2bn against its US offshore projects.
None of that is inconsistent. Prudence is asymmetric by design: losses are recognised, gains are not anticipated, and an issuer declining to write up on a price it believes temporary is doing what the standard asks. The uncomfortable part is elsewhere. Market variables produced a write-back at one issuer, no movement at a second and a charge at a third, and where the variable is the same, what separates the treatments is a judgement about how long a number will last, disclosed nowhere except in its result.
Where a regulator sets the discount rate
All of this holds wherever an issuer states a cause for its mark and publishes the assumptions behind it. Regulated networks with indexed asset bases fall outside it, their values moving on determinations rather than on tests, and so does European refining, which is a margin story. It travels least of all where a charge is booked and no driver named, which is bp’s position this quarter.
It matters most where the discount rate is itself a policy instrument. Eskom’s accounts for the year to 31 March 2025 test the utility as a single cash-generating unit and disclose that “A pre-tax nominal discount rate of 15.6% (2024: 16.3%) was used as derived from the NERSA determination”, a reference to the National Energy Regulator of South Africa. Value in use “exceeds the carrying amount with 9% (2024: 9%)”, and “An increase of approximately 1% (2024: 2%) in the discount rate will result in the recoverable amount equal to the carrying value.”
The same regulator sets the price path. Eskom’s test uses “the price already approved by NERSA” to 2028 and calls the result “A conservative price path … assumed to keep the price below 10%”. That table rounds to whole percentages, so 12.74 per cent for the first year appears as 13, and Eskom’s own estimate of 8.76 per cent for the year to March 2027 appears as 9. NERSA then approved 8.76 per cent for Eskom direct customers on 5 March 2026. The determination did not surprise the test; it was the number the test had assumed.
Room is what the test does not have. Eskom’s own price sensitivity reads “A reduction of 1% in the price assumption for 2027 results in the recoverable amount exceeding the carrying amount by 4%”, so one point off the tariff takes the headroom from nine per cent to four, and one point on the discount rate removes it altogether. The regulator holds both variables, and the carrying value of South Africa’s electricity system sits between them.
That is the convergence question inside a single disclosure. IRENA’s cost-of-capital modelling suggests that country-level conditions such as sovereign risk, interest rates and inflation “explain about 56% of the variation in financing costs”, roughly 2.3 times the share attributable to technology, and concludes that in emerging and developing economies the binding constraint is financing rather than technology, “with targeted de-risking the critical lever”. If carrying values are set by discount rates, whether the transition gets financed outside the rich world turns on sovereign risk premia and regulatory determinations. Module prices come second.
Reading the marks
Take the marks for what they are. An impairment reads where a set of assumptions sat on one date. It is not a judgement on a technology, and Ørsted’s 2025 reversal shows the arithmetic runs both ways.
The published sensitivities need the same care. Harbour sets out four price paths, its own plus three International Energy Agency scenarios, and calls them “unlikely to reflect the future outcome”, the sensitivities themselves “stated before any management mitigation actions”. These are disclosed elasticities. Nobody is forecasting.
Three places to look, and only one lies ahead. Ørsted publishes its half year on 13 August, the first test of whether a rate-driven charge extends or reverses. Harbour has already published what one point on the discount rate costs it: $77m more against oil and gas assets, $32m against goodwill.
The third has happened. AES took a $264m pre-tax charge on the Maritza lignite plant in Bulgaria, writing it down to a fair value of $141m on an income approach. Its own filing puts that charge down to “limiting the future use of the asset after the expiration of the current PPA”, with the decision not to fund a fuel conversion sitting behind it. Its PPA ran to May 2026, and no replacement had been agreed as at AES’s 2025 accounts. Maritza is the cleanest case in the set, a carrying value set by an offtake and almost nothing else, and what a replacement is worth will settle whether the plant is stranded or merely uncontracted.
The bottom line for an allocator is duller than either headline. Nothing here settles whether low-carbon economics have turned, and the same filings support both readings. What this run of accounts establishes is narrower: every mark in it was set by a rate, a contract, a policy, a demand forecast, a grid connection date or a revision to reserves or decommissioning, and not one by the price of a turbine or a module. On that test an unhedged offshore wind farm and an unhedged lignite plant have more in common with each other than either has with a regulated wire. Whether it holds for another two reporting seasons depends on a rate path nobody in these filings claims to know.
Sources
- bp p.l.c., “Group results: Second quarter and half year 2026”, 4 August 2026. Stock exchange announcement, as reproduced by Investegate.
- bp p.l.c., “2Q26 bp Trading Statement”, 14 July 2026. Stock exchange announcement, as reproduced by Investegate.
- bp p.l.c., “bp p.l.c. announces leadership transition”, 17 December 2025.
- Shell plc, “Shell plc 2nd quarter and half year 2026 unaudited results”, 30 July 2026. Company release, as carried by GlobeNewswire.
- Ørsted A/S, “Interim report, first quarter 2026”, 6 May 2026.
- Ørsted A/S, “Ørsted’s financial calendar 2026”, 12 November 2025.
- Drax Group plc, “Full year results for the twelve months ended 31 December 2025”, 26 February 2026.
- SSE plc, “Preliminary results for the year ended 31 March 2026”, 28 May 2026.
- National Grid plc, “2025/26 Full Year Results Statement”, 14 May 2026.
- Gresham House Energy Storage Fund plc, “Full-Year Results to 31 December 2025”, 21 April 2026. Stock exchange announcement, as reproduced by Investegate.
- Harbour Energy plc, “Full-year results 2025”, 5 March 2026.
- TotalEnergies SE, “Second quarter and first half 2026 results”, 23 July 2026.
- The AES Corporation, “Form 10-K for the fiscal year ended 31 December 2025”, filed 2 March 2026.
- The AES Corporation, “Form 8-K, Item 2.06: Material Impairments”, filed 16 January 2026.
- International Renewable Energy Agency, “Renewable Power Generation Costs in 2025: Executive Summary”, 2 July 2026.
- United States Energy Information Administration, “Assumptions to the Annual Energy Outlook 2026: Electricity Market Module”, April 2026.
- Eskom Holdings SOC Ltd, “Annual Financial Statements 2025”, 30 September 2025.
- National Energy Regulator of South Africa, “NERSA approves the Eskom retail tariffs and structural adjustment application for the 2026/27 financial year”, 10 March 2026.
- Saudi Arabian Oil Company, “Aramco announces second quarter and half year 2026 results”, 4 August 2026.
- Investing.com, “Aramco H1 2026 slides: profit surges 29% amid historic supply shock”, 4 August 2026, reporting Aramco’s results slides.
You may have an interest in also reading…
KenGen Powering East Africa’s Clean Energy Future
Kenya Electricity Generating Company PLC (KenGen) stands as East Africa’s leading power producer, entrusted with the mandate to develop, manage
Project Spark: Powering Southern Africa’s Future Through a Balanced Energy Mix
Namibia’s first gas-to-power plant aims to address the region’s chronic energy shortages through a pragmatic, balanced approach that blends innovation,

2025: When Markets Made Renewables Dispatchable
For years, the energy transition was argued as much on ideology as on engineering. Supporters framed renewables as a moral
