


Otaviano Canuto: Going Around the Bend? Assessing the Phillips Curve May Be of Help
Unemployment and wage rates are theoretically linked, and may hold a key to our immediate economic future.
 Current global stagflation may evolve to become a soft landing, a sharp downturn, or a deep recession. It will all depend on how fast inflation responds to economic deceleration.
That involves guessing the shift in major economies’ Phillips Curves. The economic model, named after William Phillips, hypothesises a link between reductions in unemployment and increased wage rates.
Some areas of financial intermediation — such as the sudden disappearance of liquidity — have recently developed increased vulnerability. Significant shocks could cause the Phillips Curve to exhibit higher unemployment and under-utilisation of capacity — even as inflation rates decline.
Global inflation has triggered the simultaneous tightening of monetary and fiscal policies. Economic growth projections for 2023 have been revised downward. Inflation rates will come down only gradually, given the price stickiness of their core components. The world faces a situation of stagflation — a combination of significant inflation and low or negative GDP growth.
The evolution of the situation will depend on how fast inflation drops in response to economic deceleration. This can be assessed by the Phillips Curve shifts in major economies, reflecting the cross-border spill-over of country-specific policy choices. Any abrupt deterioration in financial conditions may cause Phillips Curve movement.
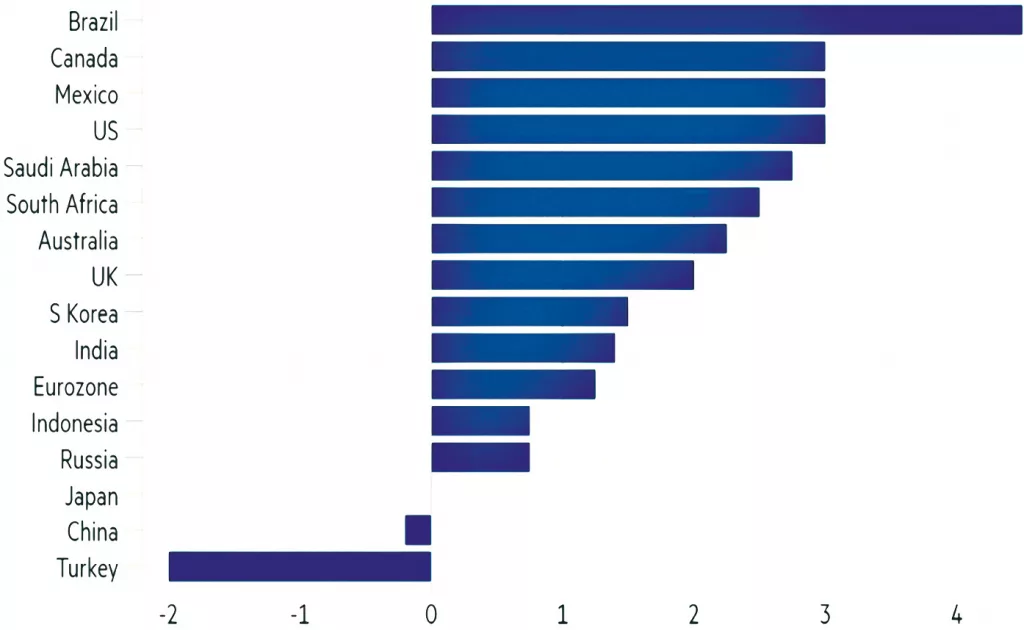
Figure 1 (1/2): Change in central bank policy rates since Dec 31 2021 (G20, except Argentina (+37%pts), % points). Source: Wolf (2022).
A global recession — global GDP rising more slowly than population growth — is a strong possibility. The combination of economic slowdown and inflation will vary in different countries, but it will be a common feature.
Here we compare the underpinnings of the inflation/unemployment trade-off in the 1970s and ‘80s and the current storm provoked by the pandemic and the war in Ukraine.
Recent challenges arise from the appreciation of the US dollar relative to other currencies, particularly those of other major economies. This may reinforce the contractionary pressures on the global economy. In emerging-market and developing countries (EMDEs), although exchange-rate depreciation has not been as intense as in non-US advanced economies, vulnerabilities associated with dollar-denominated liabilities could intensify problems.
Recent interest rate rises have been widespread. The left side of Figure 1 depicts basic interest rate hikes since 2021, while its right shows market estimates of rate hikes.
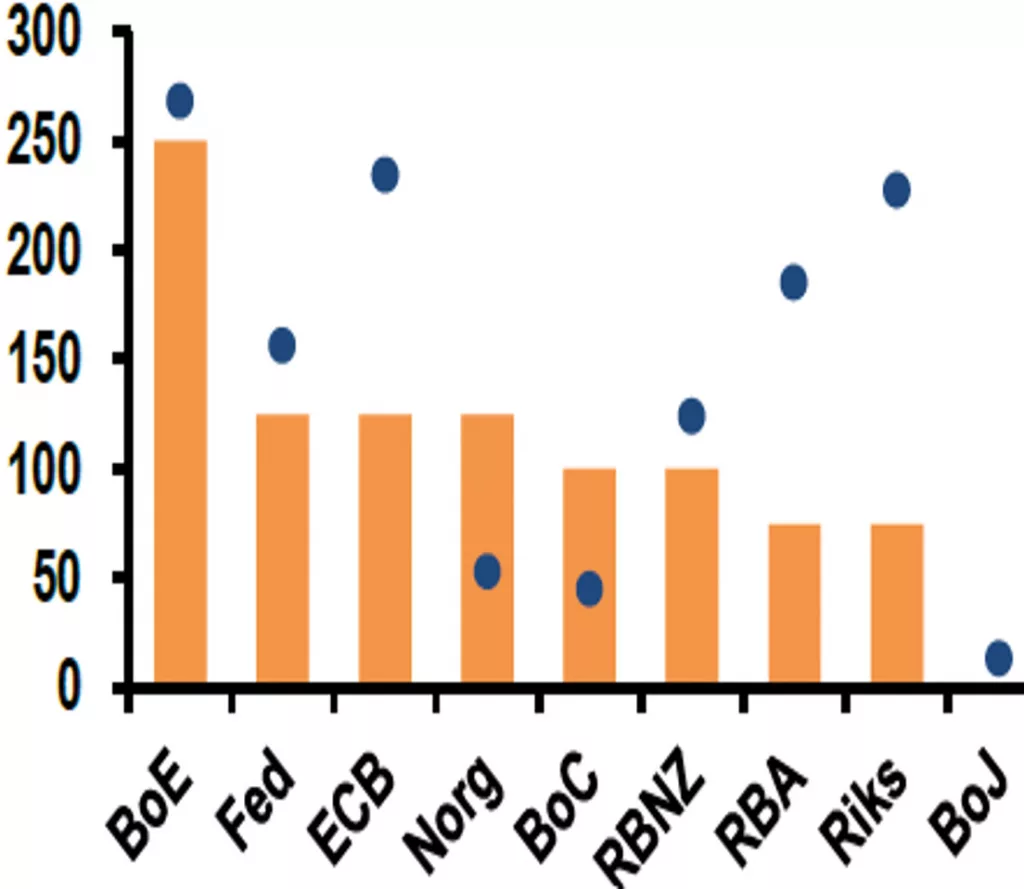
Figure 1 (2/2): Global Monetary Policy Tightening.
Note: Bp – basis points. Source: J.P. Morgan Global Economics.
On September 21, 2022, the Fed raised the target for the federal funds rate by 75 basis points, bringing it into the 3-to-3.25 percent range. The Fed maintains that further rate hikes are appropriate. It notes that while national spending and production have declined, the increase in employment has been robust. Individual projections by the members of the Fed’s Open Market Committee (FOMC) have changed from those issued in June. The September median federal-funds interest rate projections pointed to a rate of 4.4 percent by year’s end.
Rates are expected to rise in early 2023, with a projected peak of 4.6 percent. Fed chairman Jerome Powell said rates must remain restrictive enough to keep the US economy running below its potential to reduce inflation.
This appeared in downward revisions to forecasts for real GDP growth: 0.2 percent year-on-year in Q4 2022, followed by 1.2 percent and 1.7 percent in 2023 and 2024. Growth over the next two years will be below the estimated potential level of 1.8 percent. The Fed believes inflation will not reach its target until 2025.
The Fed has also revised its forecast for the unemployment rate, predicting a rise from 3.7 percent now to 4.4 percent by the end of 2023. Historically, a rise of this magnitude over one year has always been followed by a recession.
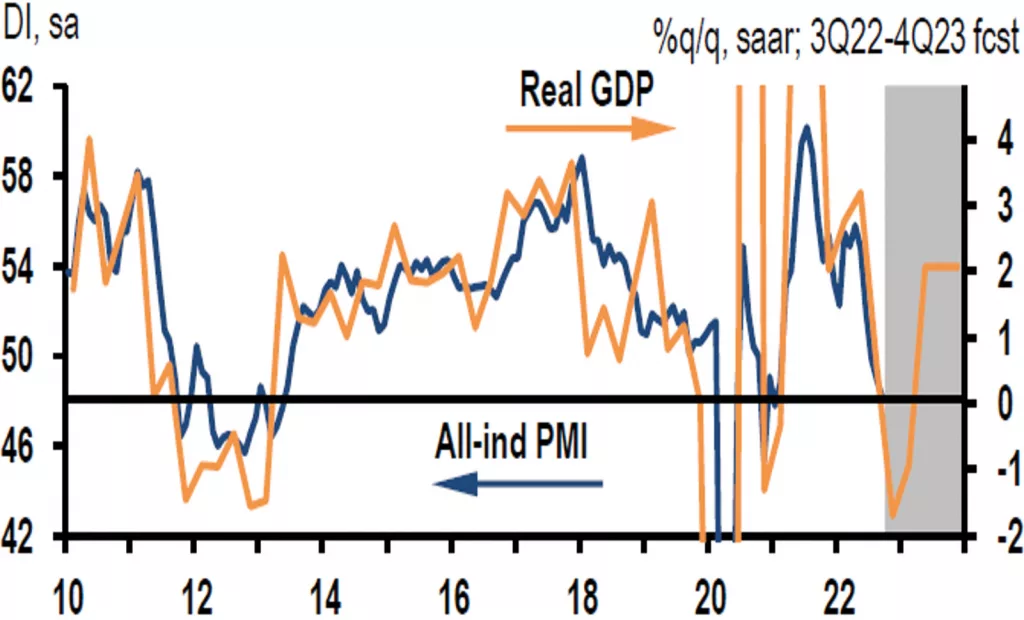
Figure 2: Euro-Area All-Industry PMI and Real GDP. Source: J.P. Morgan Global Economics.
Two consecutive quarterly negative GDP numbers are enough to state that the US economy is already in recession (Canuto, 2022a). With a discrepancy between negative GDP and positive gross domestic income (GDI) numbers in the second quarter, the performance of the labour market did not point to strong deceleration.
There is a general rise in interest rates, as seen in Figure 1, with the exception of China, Japan, and Turkey. In the week of the Fed’s September meeting, central banks in Switzerland, Sweden, Norway, Denmark, Hong Kong (China), the UK, Indonesia, the Philippines, and South Africa all hiked rates, as the European Central Bank and the Bank of Canada had done the previous week. In Brazil, there was no increase, as a strong cycle of interest rate hikes had already occurred.
In July 2022, the European Central Bank (ECB) hiked interest rates for the first time in 11 years. In September, it agreed an increase of 75 basis points. After being at zero or in negative territory for more than a decade, the European Union now has a rate of 0.75 percent. The ECB’s interest rate should continue to rise. In the euro area, industrial production dropped in July 2022 (Figure 2), as a result of the energy price shock, while headline inflation projected for September was already close to 10 percent per year.
Higher inflation has prompted central banks around the world to push their restrictive buttons, with exceptions in China, Russia, Japan, and Turkey (Figure 1 (1/2)).
There is an intrinsic challenge to the globalised economy. Each central bank looks to its own country when deciding monetary policies. In such an interdependent economy, the repercussions go beyond borders. The probability of feedback from restrictive monetary policies is greater when there is response to a common inflationary problem.
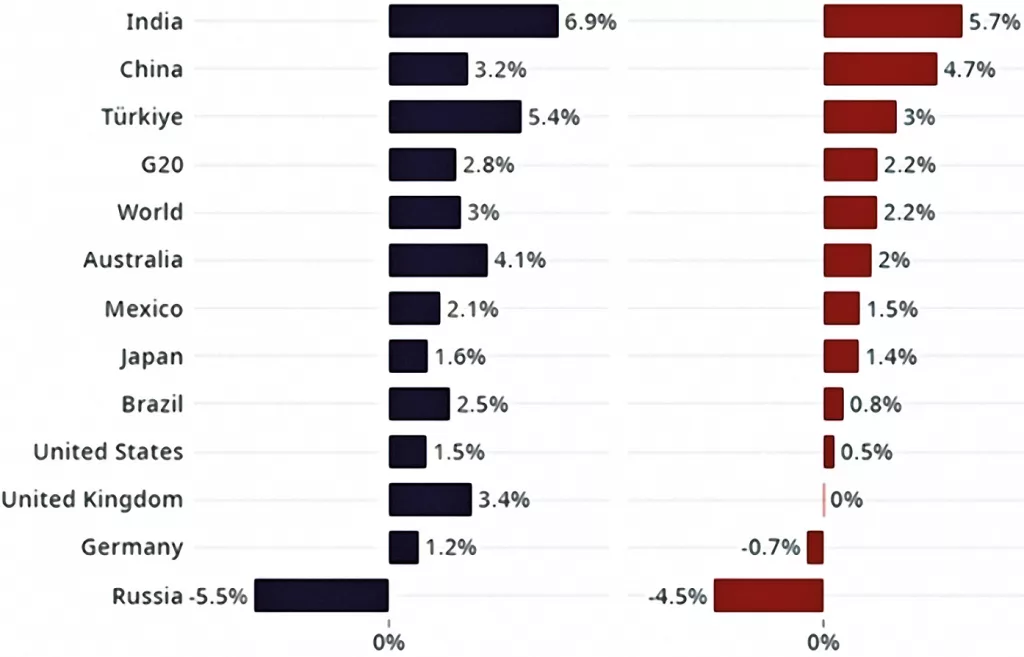
Figure 3: Real GDP Growth Projections for 2022 and 2023 (selected countries, year-over-year, percent). Source: OECD (2022).
The combination of higher energy prices, US dollar appreciation relative to the euro, China’s growth deceleration, and risks of a second eurozone debt crisis as interest rates and risk premium on Italian bonds rise, means a probable recession in Europe. Taking into account the slowdown in America, a global recession is likely.
A September report by the World Bank (Guénette et al, 2022) noted that despite the global slowdown in growth, inflation in many countries has risen to the highest levels in decades. The global economy is experiencing a period of international synchronicity in the tightening of monetary and fiscal policies — like the one that preceded the 1982 global recession.
A key variable is the evolution of the inflation rate as it hovers around multi-decade highs in Europe and the US. With activity weakening, monetary policy commands strong credibility, and inflation expectations remain stable for Europe and the US. One concern is that high inflation itself raises the risk for second-round effects on wages.
It remains to be seen to what extent price feedback and the inflationary spiral will yield to fiscal and monetary tightening. The downward revision of global growth projections for 2022 and 2023 has been remarkable.
The September 2022 OECD Economic Outlook revised downward its GDP growth projections in 2022 and 2023 (Figure 3). Global growth is likely to slow in 2023 to an annual rate of 2.2 percent. with to the OECD forecasts from December 2021, before Russia’s invasion of Ukraine, global GDP is projected to be at least $2.8tn lower in 2023.
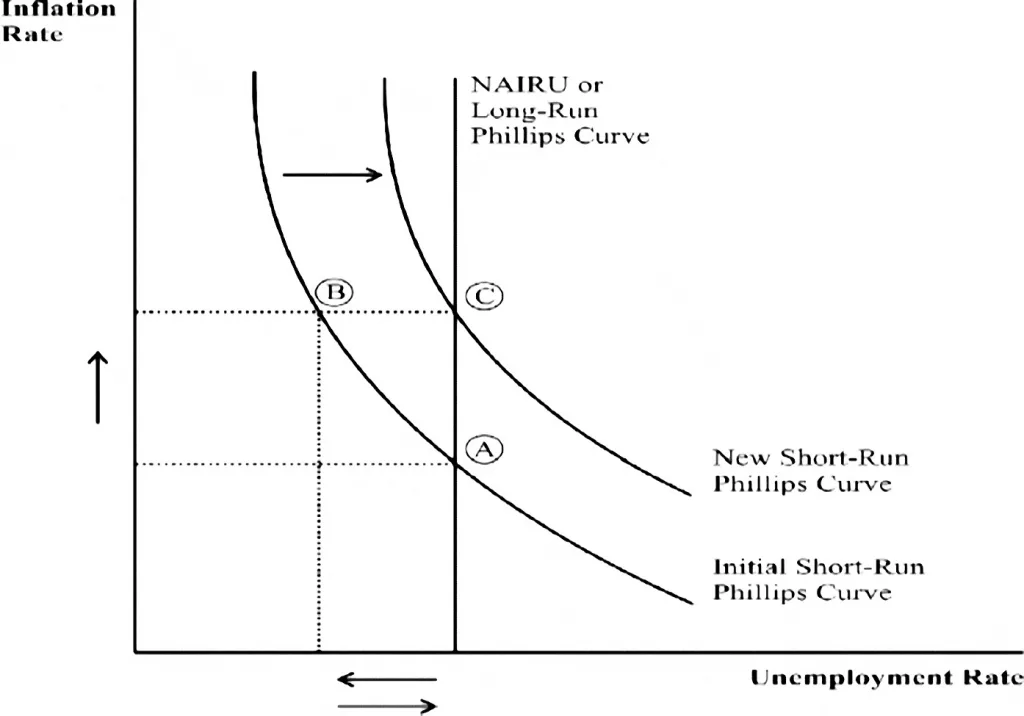
Figure 4: The Phillips Curve. Source: Dritsaki and Dritsaki (2013).
Whither the Phillips Curve?
Inflationary pressures increase as unemployment declines or the heating of economic activity starts to conflict with its capacity, and vice-versa.
Interest-rate decisions by central banks depend on the level of aggregate demand and the extent to which potential GDP will be under- or over-utilised. The Phillips Curve expresses the inflation-unemployment dilemma.
In principle, there is a level of interest rates at which demand pressures would not be excessive, or would be insufficient in relation to potential GDP. This is called the neutral interest rate: inflation and unemployment would tend to remain stable. There is a certain rate of unemployment at which inflation remains stable — the non-inflation accelerating rate of unemployment (NAIRU).
The relationship between unemployment and inflation does not necessarily remain stable. There are endogenous changes when an economy spends time above or below the neutral level.
In situations of overheating and rising inflation, vicious circles of inflationary feedback can arise. Expectations and behavioural feedback will only be reversed if the economy spends some time below its potential, during which the inertia of inflation will keep it going for some time.
This is illustrated by the shift of the initial short-run Phillips Curve toward a new short-run Phillips curve (Figure 4), after some time spent at point B rather than point A. Stability can then only be reached when the unemployment rate moves back to NAIRU (point C). Any return to point A will demand a period of unemployment rates above NAIRU, coupled with an unwinding of inflation expectations and of wage-price spirals.
Stagflation — significant inflation, high unemployment, and zero or low economic growth — observed in the US in the 1970s and 1980s corresponded to being in a zone to the right of point C. The Phillips Curve had shifted upwards, and inflation only declined after a period of high unemployment.
The following decades saw the period of “great moderation”, the period of low macro-economic volatility from the mid-1980s until the 2007-2008 financial crisis. The Phillips Curve had shifted down.
After the recession that followed the GFC, the shift seemed to have been confirmed. The US economy took a while to recover but expanded for more than a decade — at rates below historical averages, but corresponding to a period without recessions.
Inflation remained below the Federal Reserve’s two percent target, averaging 1.7 percent throughout the expansion. The looseness of monetary policy — including quantitative easing, or the Fed buying government bonds and mortgages — did not affect inflation (Canuto, 2022d).
Two main factors explain this flattening of the Phillips Curve: the anchoring of inflation expectations at low levels, and the possibilities opened by the globalised economy. Instead of upward pressures on the domestic prices of products that might be in short supply, imports could absorb demand. In the absence of generalised overheating, globalisation could function as a buffer against inflation.
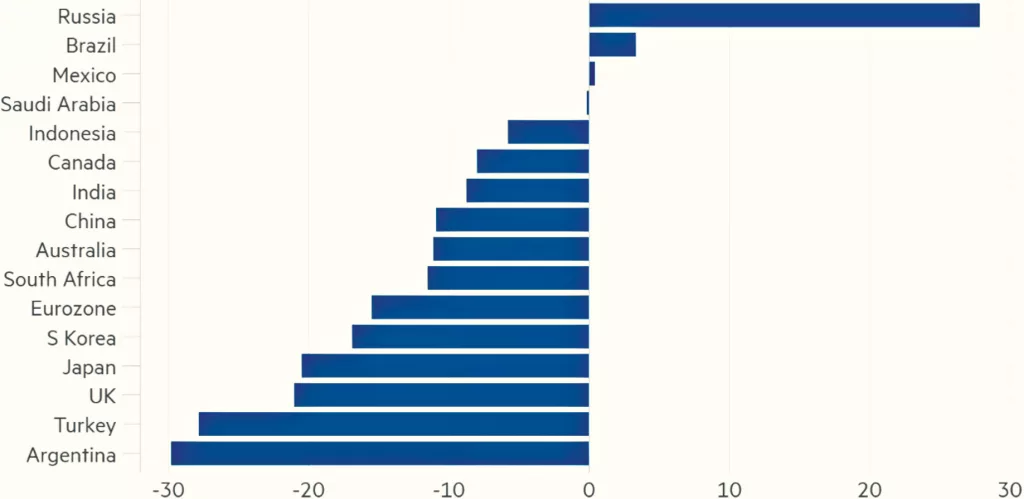
Figure 5: G20 Currencies Relative to the U.S. Dollar in 2022. Source: Wolf (2022).
The rise in inflation from pandemic supply shocks and the invasion of Ukraine created the “perfect storm”. Accelerated inflation came to be recognised as something that is not automatically reversible. It reflects the size of fiscal and monetary stimulus in advanced economies, with the channelling of demand for goods creating bottlenecks in supply chains. In addition, the workforce has contracted, reducing employment levels.
The Phillips Curve has shifted again. Gita Gopinath, the IMF’s first deputy managing director, outlined this at the Federal Reserve’s Jackson Hole Economic Symposium in August. Less than a quarter of a percentage point of the rise in inflation can be attributed to unemployment falling below the NAIRU (Gopinah, 2022). In any case, there is now a simultaneous development internationally in the tightening of monetary and fiscal policies, making a global recession likely, as we have discussed.
And now? Where will the Phillips curve go? Will the relationship return to how it was before the pandemic?
According to the Institute of International Finance (Brooks et al, 2022), the effect of the pandemic as a source of shocks on supply chains seems to have ended, given the stage of normalisation of delivery times and the reduction of its upward pressure on inflation. On the supply side, there are still the impacts of the war in Ukraine on global inflation, especially in Europe.
Post-pandemic job supply will remain difficult to predict. There is also the risk that “relative deglobalisation” of value chains undermines the balancing of supply and demand via foreign trade, rather than domestic prices.
On the aggregate demand side, will the long-term low interest rates bring structural changes? Gopinath suggested that while demographics, income inequality, and a preference for safe assets will continue to keep rates low, higher post-pandemic debt and inflationary shocks accompanying the energy transition will work in the opposite direction.
The Philips Curve will keep moving. It is necessary to verify whether monetary adjustment programmes will be effective in keeping inflationary targets as anchors for expectations. This may affect which growth deceleration scenario prevails.
Dollar Appreciation Contractionary?
Dollar appreciation may reinforce the contractionary pressure on the global economy. In emerging market and developing countries (EMDEs), vulnerabilities associated with dollar-denominated liabilities may lead to intensified problems.
Take the US Dollar Index (DXY), a measure of the value of the dollar against six other currencies. On September 28, the DXY was at its highest level since May 2002. Compared to the beginning of 2022, the dollar was up 18 percent against the euro, and 26 percent against the Japanese yen and British pound. Figure 5 shows how 20 G20 currencies have so far in 2022 evolved.
A key additional driver of dollar appreciation has been the higher yield in real terms of US assets relative to others. Figure 6 shows the differential in real yields between America and the euro area, as measured by yields on five-year inflation-indexed government bonds paired with the euro-dollar depreciation. It reflects the more rapid interest rate moves in the US, followed by market expectations about the Fed’s anti-inflation drive.
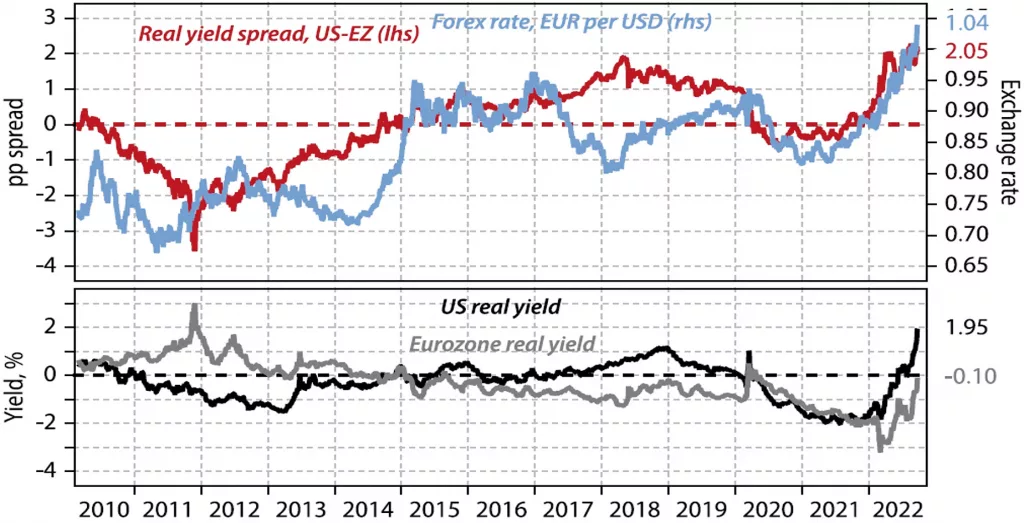
Figure 6: U.S. and Euro Area – Real Yields and Exchange Rates.
Source: Denyer, W. (2022). The Key Drivers for Currencies, Gavekal Research, September 28 (gavekal.com).
According to W Denyer, a similar picture may be built for the comparison of risk-adjusted rates of return for other fixed-income assets. Further bouts of dollar appreciation might happen if the other central banks continue to lag in setting interest rates and/or the pace of adjustment by the Fed. One-off events, such as an intense depreciation of the British pound caused by a proposal for unfunded tax cuts, were partly reversed.
Some countries have tried direct interventions in exchange rates instead of — or as a complement to — lifting domestic interest rates. Japan has opted to sell US Treasury bond reserves to try to counteract the yen’s exchange rate devaluation against the dollar. Switzerland is also said to be considering selling foreign currency to support the Swiss franc, as well as raising interest rates.
After the 2008-2009 global financial crisis there were “currency wars”, when countries accused each other of exporting their unemployment problems through significant reductions in domestic interest rates and currency devaluation. A reverse currency war may now be emerging. In the absence of some sort of new Plaza Accord, individual countries’ efforts to evade interest rate adjustments via direct interventions in exchange markets will have limited effect if the underlying factors leading to capital flows are not altered.
Besides hurting US multinational companies’ profits from abroad, and emerging markets’ dollar-denominated foreign liabilities, dollar appreciation may lead to inflationary shocks and tighten monetary policies. Feedback loops of restrictive policies may be sparked.
Where Phillips Curves have moved to will matter.
Near-Term Scenarios
Since the beginning of 2022, a rapid deterioration of growth prospects, rising inflation and tightening financing conditions have ignited a debate about the possibility of a contraction in global per-capita GDP.
Forecasts for global growth have fallen since the beginning of 2022. They don’t point yet to a global recession in 2022–2023, but Guénette and others call attention to earlier recessions.
Every global recession since 1970 was preceded by a weakening of global growth in the previous year. All previous global recessions coincided with sharp slowdowns or recessions in several major economies.
Despite the current slowdown, inflation has risen to multi-decade highs. To curb the risks from persistently high inflation, many countries are withdrawing monetary and fiscal support. The global economy is in one of the most internationally synchronous episodes of monetary and fiscal policy tightening of recent decades.
These policy actions are understood as necessary to contain inflationary pressures. But their mutually compounding effects could lead to greater impacts in terms of tightening financial conditions and growth slowdown. These policy conditions were not seen in the 1975 global recession, but they were before the one in 1982.
Guénette proposes three scenarios for 2022-2024. The first baseline scenario follows closely recent consensus forecasts of growth and inflation, as well as market expectations for policy interest rates. This is the soft-landing scenario, in which global growth is forecast to slow from 2.9 percent in 2022 to 2.4 percent in 2023, rising to three percent in 2024. The slowdown in 2023 would lead to growth in per-capita terms approaching that of the downturn episodes of 1998 and 2012. Global trade growth would reflect a broad-based weakening of demand in 2023, before accelerating in 2024.
Growth in advanced economies would slow from 2022 to 2023, before recovering somewhat in 2024. Growth in EMDEs would accelerate from 2022 to 2024 as global headwinds fade and post-pandemic recovery continues.
After peaking at 7.7 percent in 2022, global headline CPI inflation in the baseline scenario would remain high relative to the inflation target into 2023, at 4.6 percent. The projection for 2024, at 3.2 percent, is in line with a gradual approach to the target, about 2.5 percent at the global level in GDP-weighted terms (average 2 percent in the US).
Inflation in EMDEs is projected to decline from 9.4 percent in 2022 to 4.5 percent in 2024, above its aggregate target of 3.5 percent. The decline in core CPI inflation, which excludes the volatile energy component, would be more sluggish. Given this inflation outlook and the expected path of policy rates, short-term interest rates would remain negative, or near zero, in real terms throughout most of the projection horizon.
The degree of monetary policy tightening currently expected may not be enough to restore low inflation quickly enough.
The second scenario — sharp downturn — supposes an upward move in inflation, which would lead to additional synchronous monetary policy tightening by central banks.
Central banks in advanced economies and EMDEs could raise their benchmark policy rates by a cumulative 100 basis points above baseline assumptions until the end of 2023, deciding to sustain this differential through 2024. In this scenario, the global economy would still escape a recession in 2023 but would go through a sharp downturn without restoring low inflation by the end of the next year.
While headline inflation would continue its downward trajectory in 2024, it would do it at a slower pace. The decline in core inflation would be broadly unchanged relative to the baseline scenario, as the upward pressure from higher inflation expectations would counterbalance the muted impact of widening output gaps.
According to model-based projections of Guénette et al, the global economy would still escape a recession despite undergoing a global downturn (in per-capita terms) on par with that in 2001, and worse than those of 1998 and 2012. Advanced economies overall would not see a contraction of output in 2023, with growth of 0.5 percent. But the additional tightening of monetary policy would lead to technical recessions: two consecutive quarters of negative quarter-over-quarter growth in the United States and the euro area. Recovery of activity in this scenario would take place in 2024. The projected GDP growth rate of 2.7 percent would be 0.3 percent below the baseline-scenario rate.
In the third scenario — global recession — the additional increases in policy rates would trigger a sharp re-pricing of risk in global financial markets, resulting in a global recession in 2023.
Abrupt policy shifts in major economies might cause deep global financial stress, aggravating macro-economic vulnerabilities. The focus on inflation reduction would constrain the ability of central banks to provide relief to stressed financial markets, beyond some eventual targeted credit-easing to alleviate acute liquidity shortages in key funding markets. Fiscal policy is expected to face similar constraints, preventing governments from implementing large-scale support measures, particularly after the higher public debt left as a legacy of the pandemic.
The headwinds from the globally synchronous policy tightening would be compounded by a sharp deterioration of global financial conditions. Global GDP growth would decline by 1.9 percent in 2023 and one percent in 2024, compared to the figures of the baseline scenario. Those numbers are comparable to the 1982 recession, with growth slowing to 0.5 percent. Global GDP per capita would contract by 0.4 percent, in line with the 1991 recession, although milder than the 1982 episode when the population grew faster.
The evolution of global output would be within historical experience over the past five decades. Permanent output losses relative to pre-pandemic trends would be greater in this third scenario.
Globally, policymakers need to stand ready to manage the potential spill-overs from the globally synchronous withdrawal of growth-supporting policies.
Ultimately, policymakers must cope with the dilemmas put before them as depicted in Phillips Curves, whatever the configuration of parameters currently defining their shapes. Downward stickiness of inflation rates and the evolution of financial conditions (embedding various possible stress levels) will define the eventual scenario.
An important “known unknown” is whether worsening financial conditions will trigger a financial shock, regardless of Phillips Curves. Aggregate corporate and household measures of vulnerabilities do not show the levels of fragility seen in previous crisis moments. Many corporates have used pandemics responses, via liquidity abundance and low long-term interest rates, as a window of opportunity to extend the duration at low cost of their liabilities.
Some point to areas of financial intermediation that have developed a high vulnerability to shocks — such as sudden disappearance of liquidity — in the recent past. Chapter Three of the IMF’s October Global Financial Stability Report approaches how open-end funds, which offer daily redemptions while holding illiquid assets, have acquired a significant role. They are vulnerable to investor runs and asset fire sales that can be triggered by sudden liquidity shocks.
As large banks ceased to act as market makers since the global financial crisis, and voluntary and regulatory restrictions are replaced by non-banking financial institutions, sudden disappearance of liquidity has become more frequent and troublesome.
Central banks are currently doing “quantitative tightening” and any U-turn on provision of liquidity to markets may signal a weakening of their drive against inflation.
Housing markets are reeling from the elevation of mortgage rates. The long era of low interest rates has generated substantial overvaluation of assets relative to earnings. Private equity and venture capital funds have bloomed.
As interest rates have entered the on-going upward phase, negative surprises may come from various spots, and may aggravate the macro-economic downturn.
The Phillips Curve would then exhibit higher unemployment rates, or under-utilisation of capacity, even as inflation rates move down. i
First appeared at Policy Centre for the New South.
About the Author
Otaviano Canuto, based in Washington, D.C, is a senior fellow at the Policy Center for the New South, a nonresident senior fellow at Brookings Institution, a visiting public policy fellow at ILAS-Columbia, and principal of the Center for Macroeconomics and Development. He is a former vice-president and a former executive director at the World Bank, a former executive director at the International Monetary Fund and a former vice-president at the Inter-American Development Bank. He is also a former deputy minister for international affairs at Brazil’s Ministry of Finance and a former professor of economics at University of São Paulo and University of Campinas, Brazil. Otaviano has been a regular columnist for CFI.co for the past ten years.
Follow him on Twitter: @ocanuto
You may have an interest in also reading…

Paolo Sironi, IBM: Mind the Gap Between Small-Medium Businesses and Their Banks
Financial services are adapting to better serve SMEs, but a gap remains between what banks offer and what these businesses
Otaviano Canuto: The US Economic ‘K’
Global GDP growth has proven resilient in 2025, despite the shocks caused by the trade policies implemented by United States President

CABEI’s AA+ Breakthrough: How a Smarter Balance Sheet Is Financing Central America’s Next Growth Chapter
The Central American Bank for Economic Integration (CABEI) has secured an S&P upgrade to AA+, capping a year of balance-sheet
