


Otaviano Canuto: Growth Implications from a Fractured Trading System
To understand the implications of a fractured trading system, let’s use the period known as hyper-globalisation, or globalisation 2.0, as a benchmark.
In the 1980s and ‘90s, we saw the consequences of a tectonic shift deep beneath the global economy. This was due to a combination of factors.
First, a cluster of technological innovations in IT and transport. Containerisation allowed manufacturing processes to be broken down to new levels of detail.
Second was the widespread adoption of trade liberalisation policies. In most countries, there was a move in favour of reducing tariffs and non-tariff trade barriers.
Lastly, the incorporation of a billion workers with lower wage aspirations into the global supply of labour for market economies. Not only the collapse of eastern European communist regimes, but also Chinese President Deng Xiaoping’s creation of special economic sones to boost exports and imports as a share of national GDP.
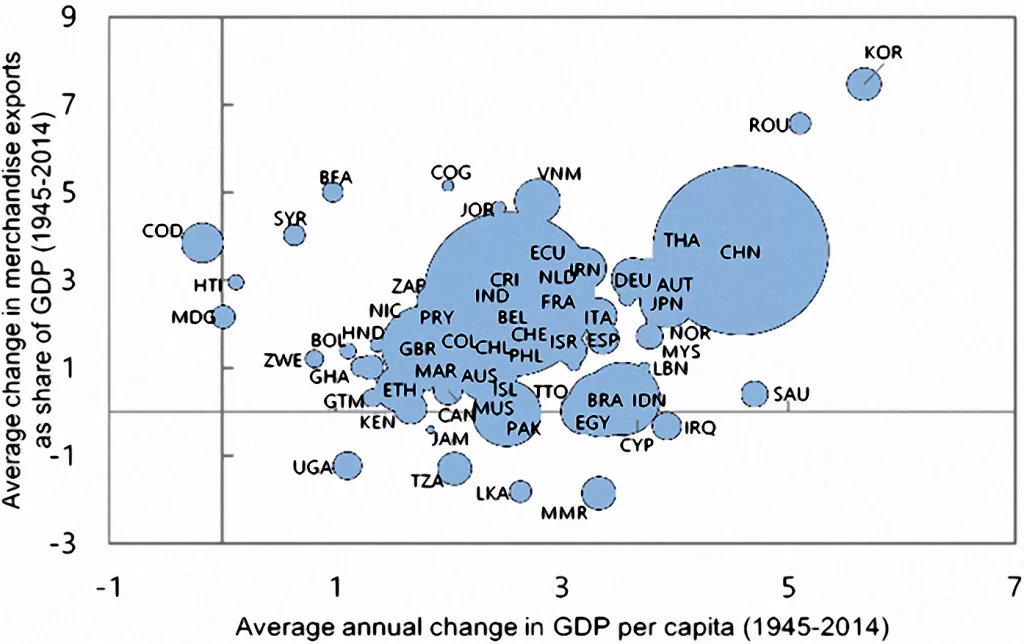
Chart 1: Growth of GDP and trade, 1995-2014. Average annual change in real GDP per capita vs. average annual change in exports as % of GDP. Source: Aiyar, S. et al (2023). Geoeconomic fragmentation and the future of multilateralism, IMF Staff Discussion Notes SDN/2023/001.
There was substantial growth in GDP per capita in emerging markets and developing economies. The correlation between trade insertion in exports and increases in GDP per capita can be seen in Chart 1. And there was a change in the composition of the global economy and trade, involving China and other emerging markets and economies.
This resulted in significant reductions in poverty rates. At the same time, there was a two-way trend with respect to inequality. There was more balance in per-capita income, and a simultaneous rise in within-country inequality, particularly in advanced economies, as depicted in Chart 2.
These were direct results of trade integration.

Chart 2: Global inequality, 1988-2013. Source: World Bank (2016). Poverty and shared prosperity 2016: taking on inequality.
Along with higher foreign trade came the transfer and local absorption of knowledge and technology in the form of machines, equipment, and less tangible things, accompanying the formation of global value chains. This is evident in International Monetary Fund estimates of how foreign knowledge contributed to labour productivity growth among advanced economies and in emerging market economies. As shown in Chart 3, the IMF estimates that from 2004 to 2014, foreign knowledge accounted for about 0.7 percentage points of labour productivity growth per year, corresponding with 40 percent of sectoral productivity growth. This is substantial after a decade in which that contribution reached 0.4 percentage points annually.
Before anyone thinks these results are due only to China, they are robust — even when one excludes that country from the analysis. China is a unique case because of its sise and growth rates, but this is an observation that can be generalised to cover the transfer of knowledge.
That translates into better results when accompanied by domestic endeavours. As the World Bank has highlighted in many studies, technological capabilities are usually idiosyncratic and local. They are necessary to effectively use foreign knowledge. This has been the case for countries like South Korea and China, evidenced by patent filings and R&D expenditures.
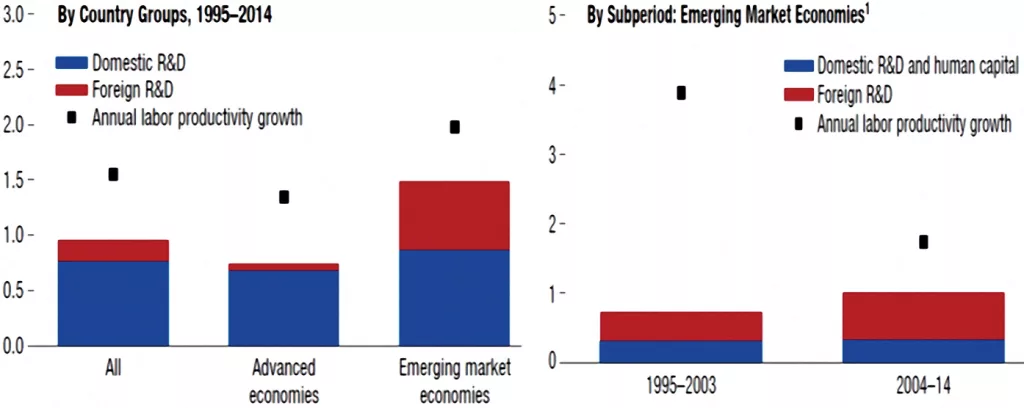
Chart 3: Contribution of Foreign Knowledge to Labor Productivity Growth. Annual percent growth, cross-country averages.
Source: World Economic Outlook, April 2018.
Now we come to the phase of “slowbalisation”. Note, in Chart 4, that cross-border flows of goods, services, and capital slowed after the global financial crisis. There are several hypotheses about this. One is that the major wave of fragmentation associated with manufacturing had reached a plateau. For it to continue as a driving force, we would need to see what happened in China replicated in other countries. This started to happen to an extent in Vietnam; India remains the significant absentee.
Another hypothesis is that advanced countries transitioned more towards service-based economies. Services are less trade-intensive, and the internationalisation of services hasn’t occurred to the same degree as with manufacturing.
The average industrialised country saw an increase in the Gini Index from 30 to 33 between 1988 and 2008, marking greater inequality. It must be clear that globalisation cannot alone be held responsible for the rise in economic inequality in advanced economies.
Technological change had more to do with that, combined with a lack of appropriate social-protection systems. It also caused a worsening of working conditions in the US and UK. Globalisation cannot be made the scapegoat for imports from Mexico and China creating doldrums in blue-collar US; nor can labour immigration be seen as a reason for Brexit.
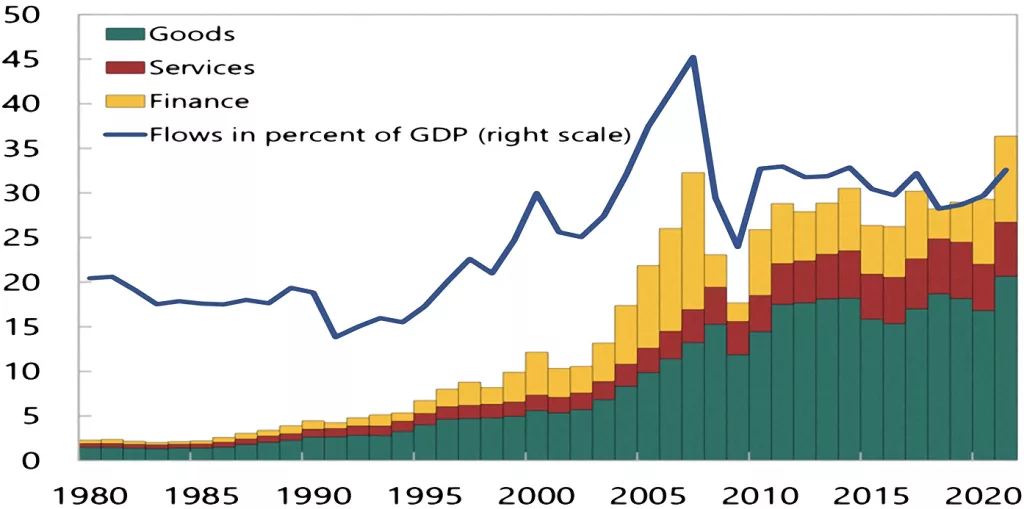
Chart 4: Global flows of goods, services, and finance (US$ trillion, unless indicated otherwise). Source: Aiyar, S. et al (2023). Geoeconomic fragmentation and the future of multilateralism, IMF Staff Discussion Notes SDN/2023/001.
The global economy has gone through multiple shocks, the perfect-storm combination of a pandemic, war, climate change, the emergence of the “new Washington consensus”, and ongoing technological rivalry.
The permanent impacts of the pandemic will be limited. It led to a trade-off between resilience and efficiency, but that doesn’t necessarily lead to reshoring. If you bring back everything, then you’ll remain as exposed to potential risks as you were when relying on global supply chains.
This logic could lead to some costly diversification or duplication of links, depending on the sectors, but not to a full reversal of globalisation. As some colleagues and I showed in a policy brief for the T20 this year, the recovery of manufacturing output, particularly in technology sectors, was really nothing commensurate with the stigma established with the pandemic.
The danger lies in the rise of national security as a determinant of economic policies.
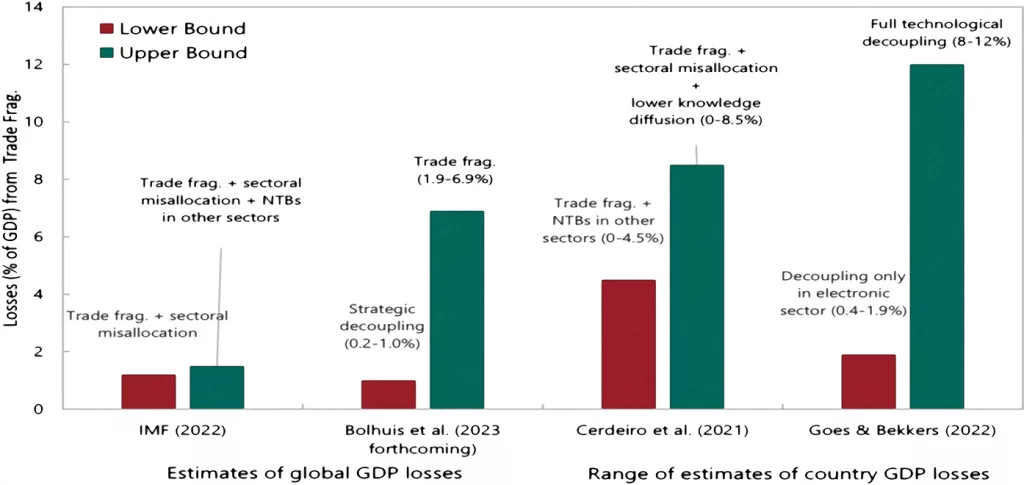
Chart 5: Long-term losses from global trade fragmentation (percent of GDP).
Source: Aiyar, S. et al (2023). Geoeconomic fragmentation and the future of multilateralism,IMF Staff Discussion Notes SDN/2023/001.
National security has been a justification for trade restrictions in those sectors where dual use of technologies and goods and services for civil and military reasons. If one looks at trade and FDI restrictions, the rise has often been justified for national-security reasons.
The transmission channels of the fragmentation will be a reversal of the path by which we attained the gains. Any estimate of costs is based on simulations from different models. Chart 5 displays the results of some studies presented in a recent IMF seminar assessing various aspects of trade fracturing.
One can conclude:
- The deeper the fragmentation, the greater the cost
- Reduced knowledge diffusion due to technological decoupling is a powerful negative amplifier
- Emerging markets and low-income countries are most at risk from fragmentation.
- Transition costs exceed the final trading impact
- Estimates are not the upper limit
- The G20 might not directly address national security, but there’s much it can do, especially on the trade-off between resilience and efficiency, discussing policies that avoid resorting to discretionary measures.
Substantial growth in GDP per capita in emerging markets and developing economies, as well as reductions in poverty rates and per-capita GDP inequality.
The transmission channels of the trade fragmentation will be a reversal of the path by which those gains were attained.
A previous version was published by the Policy Center for the New South.
You may have an interest in also reading…

The Reno Siege: Rupert Murdoch and the Great Succession Schism
As Rupert Murdoch approaches the twilight of his reign, a $3.3bn settlement in a Nevada courtroom has resolved the question

2025: When Markets Made Renewables Dispatchable
For years, the energy transition was argued as much on ideology as on engineering. Supporters framed renewables as a moral

Heat Pumps That Pay: How Industrial Process Heat Is Becoming a Cost-Saving Asset
Table of contents Why industrial heat is now a balance-sheet issue 1) The commercial frontier: process heat up to ~200°C
