


Otaviano Canuto, Center for Macroeconomics and Development: China’s Rebalancing Act is Slowly Addressing Sliding Growth Figures

Author: Otaviano Canuto (Photo: Fabio Braga/Folhapress, MERCADO)
China’s economic growth has been sliding since 2011, while its economic structure has gradually rebalanced toward lower dependence on investments and current-account surpluses.
Steadiness in that trajectory has been accompanied by rising levels of domestic private debt, as well as slow progress in rebalancing roles between private and public sectors. With the ongoing trade war with the US still unfolding, it remains unclear which growth pace China’s rebalancing will follow.
The Necessity of Rebalancing
China’s GDP growth last year (6.6%) was the lowest in the past two decades. The IMF’s update of its World Economic Prospects in January brought a forecast of 6.2% for China in 2019-2020. See Chart 1.
China’s slowdown was expected, as signs of relative exhaustion were clear by the beginning of the decade. Back in 2011, when I was a vice-president at the World Bank, I represented the institution at the 10-Year anniversary of China’s access to the World Trade Organisation (WTO) at the Hall of People in Beijing. In my remarks to then-President Hu Jintao, I conveyed some of the thinking that was to be fully displayed in 2013 in a joint report by the World Bank and the Development Research Centre of the State Council, PRC.
“China has the potential to continue its dynamic growth, quadruple per capita income to about $16,000, and become the world’s largest economy by 2030.”
China has the potential to continue its dynamic growth, quadruple per capita income to about $16,000, and become the world’s largest economy by 2030. But, to realise that potential, China needs to overcome emerging new challenges, adapt its growth model to avoid the middle-income trap, reduce its large trade surpluses to mitigate tensions with trading partners, and increasingly play an active leadership role in global forums and multilateral institutions.
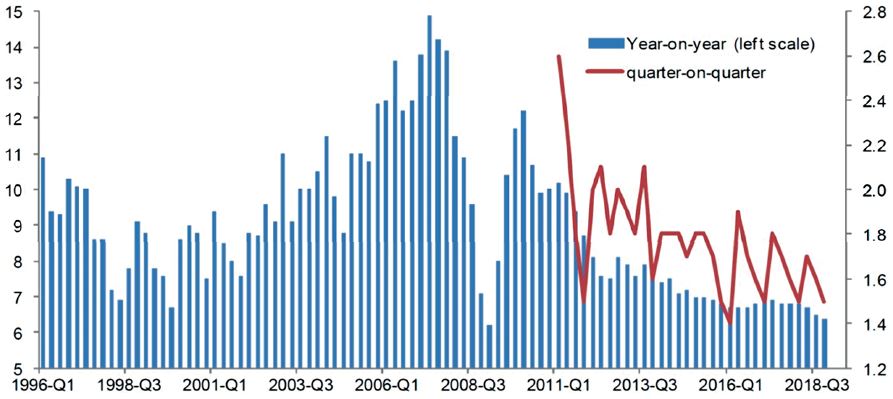
Chart 1: Chinese year-on-year GDP growth. Source: 4X Global Research, “Chinese growth slowdown – project fear?”, January 30, 2019.
China will need to increase services and consumption. By 2030, the World Bank estimates that China’s service sector could expand from 43% of GDP today to almost 60%. Consumption could also expand to 60%, from about 50% today.
Given China’s rising real wages, the country will need to upgrade to higher value-added industries, and progressively shift its labour-intensive production to lower-cost locations in Asia and Africa. This shift implies an increase in outward FDI.
China also needs to reform its state-owned enterprises to boost private sector growth and competition. Finally, to ensure sustainable growth, China will need to shift to a greener growth model.
In his final remarks at the 2011 event, President Hu Jintao said: “China will unswervingly commit to the opening-up strategy to help itself grow, and promote global development.”
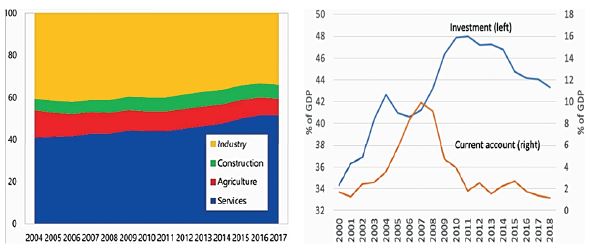
Chart 2: China’s GDP sector structure (left) and investments and current account as shares of GDP (right). Source: IMF.
The Chinese pattern of rapid growth with structural change had been accompanied by rising economic imbalances, just as the main pillars of growth seemed to be gradually weakening. High and sustained GDP growth-rates were based on elevated investment-to-GDP ratios – which were only possible with low shares of wage income and domestic consumption, as well as with cheap and repressed finance.
Another factor was dynamic markets abroad which were willing and capable of absorbing an expansion of Chinese exports – something that could not be indefinite, given the size of China’s economy. Growing income disparities were a domestic flipside of that model, a potential source of social strain along with changes in the external environment. As former Premier Wen Jiabao said in 2007, the country’s economic growth trajectory was “unstable, unbalanced, uncoordinated and unsustainable”.
Three mutually reinforcing paths of transformation were ahead, with a structural slowdown of growth on the cards.
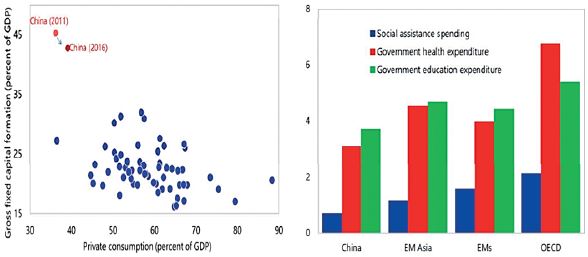
Chart 3 – Consumption- and investment-to-GDP: China vs emerging markets and advanced economies (left) and Social Spending as % of GDP (right). Source: IMF.
First, the productivity increases seen through transferring resources from low-productivity agriculture activities to industry — a typical feature of economies moving from low- to middle-income levels — had, to a large extent, already happened. On the demographic front, the old-age-dependency ratio had started to rise. Gains in economic efficiency and technological progress – based on absorption of existing, imported technologies – would have to be increasingly replaced with local innovation. The set of second-generation policy reforms necessary for that would require time, whereas low-hanging fruit, in terms of productivity increases, would be less available.
Second, a sector-structure rebalance was expected. Higher shares of services and consumption, following rising wages, with a decrease in exports, savings and investment ratios-to-GDP, should accompany the increased reliance on domestic sources of aggregate demand. Government consumption was also to rise to meet social demand, as well as the needs of operations and maintenance. The income gap between coastal areas and middle and western regions should fall as the labour pool shrank. The popular perception of rising prosperity would probably be higher than before, with rising purchasing power – despite lower GDP growth rates due to lower investment-to-GDP ratios and total factor productivity increases harder to obtain.
Third, a shift up the value chain in tradable and non-tradable activities should underpin the previous paths of change. A transition to more sophisticated production processes was already being pursued.
While moving to a less spectacular growth trajectory, China would be morphing into a mass-consumer market economy, combined with supply capacity increasingly reliant on growth of “total factor productivity”.
Clarity of the roadmap did not mean an easy ride. Chart 2 shows how the GDP sector structure has been evolving as expected, and how reliance on investment and current-account surpluses has diminished.
On the other hand, the transition toward a less investment- and export-dependent growth model took place from a starting point of very low consumption-to-GDP ratios (Chart 3, left side). Besides high profit to wages ratios, low levels of public social spending have led to high household savings (Chart 3, right side). No wonder rebalancing toward a consumption-based growth model was expected to be gradually pursued, as GDP growth rates might have collapsed, rather than sliding down. The change of growth pattern would require time-intensive structural reforms. In 2017, private consumption and investment were, respectively, 39% and 44% of GDP. In the rest of the world, 60% is the average consumption to GDP ratio (Chart 3, left side).
Fears for the global economy in the aftermath of the Global Financial Crisis were followed by countercyclical policies. In the case of China, a “great Quantitative Easing (QE)” took the form of a combination of “shadow banking” and capital expenditure on housing and infrastructure, with a high role played by special purpose vehicles (SPVs) associated with subnational entities (Canuto and Zhuang, 2015). Lending by non-bank entities through shadow finance accounted for about two-fifths of new credit by 2016.
Two features of China’s economic policies – although instrumental to sustaining the smoothness of the downslide – have become sources of concern.
The first is that the attainment of official target growth rates along the gradual slide depicted in Chart 1 has been accompanied by overcapacity in some heavy industry and construction sectors, as well as increasing debt leverage of corporates and households. Chinese authorities have alternated measures to dampen such debt trajectory before vulnerability to a sudden stop reaches any critical point with periodic loosening of fiscal, monetary and financial restrictions to avoid drastic declines in growth rates. This is depicted in the evolution of corporate and household debt as well as in the comparison of credit and nominal GDP growth rates (Chart 4, left side).
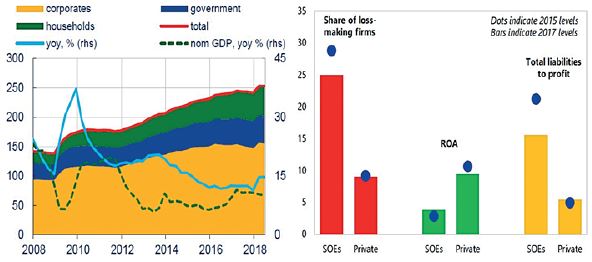
Chart 4 – China: Credit growth and debt-to-GDP (left) and Performance of State-Owned Enterprises (SOEs) vs private firms.
Sources: (left) David Lodge & Michel Soudan, “Credit, financial conditions and the business cycle in China”, ECB Working Paper Series 2244, February 2019; (right) IMF, China 2018 Article IV Consultation, July 2018.
Secondly, the “reform of state-owned enterprises to boost private sector growth and competition” I mentioned in 2011 – and at the time referred to by Chinese authorities as part of a “rebalance between public and private sectors” – has stalled. Credit is still preferentially channelled to state businesses, and competition between private firms and SOEs remains uneven in sectors where the latter was thought to open space. While large state-owned banks keep lending to SOEs, infrastructure and real estate investments are supported by shadow finance. Performance indicators (Chart 4, right side) suggest that the absence of reform of state-owned businesses has come at a cost in terms of productivity and real returns foregone.
The motivations of tackling financial risk and avoiding a sharp growth slowdown point have been pursued with policy-tuning via targeted measures of tax cuts, de-risking and regulatory changes. A difficulty stems from decreasing returns in terms of additional output obtained with the maintenance of high investments and debt accumulation. China’s public capital stock per-head exceeds those of comparable economies, residential and infrastructure investments increased dramatically, and export-led growth faces rising challenges.
Over the decade, China has thwarted “incoming financial disruption”, and retains sufficient fiscal space and foreign reserves to implement any official bail-outs that may be needed. On the other hand, avoiding a deeper growth downslide by maintaining policies in place tends to become more difficult, with decreasing returns from investment-cum-debt at the margin. With an increasing amount of capital investment needed to yield incremental units of output, for China to hold steady would require ever-increasing levels of debt.
The US-China Trade War
The ongoing trade disputes have been sparked by the US with a double motivation: to force changes in bilateral trade-flows in its favour, as well to prompt changes in Chinese policies and practices regarding technology transfer. China’s rebalance toward raising its presence in higher value-added stages in global value chains have included a resource to piggybacking at low costs on external technological sources. To this end, forced technology transfers have been imposed on foreign investors interested in attending domestic markets, besides non-recognition of intellectual property, subsidies to state-owned companies, non-tariff barriers, and similar measures. That has happened even as China’s payments for the use of US intellectual property have increased faster than the former’s GDP (Chart 5).
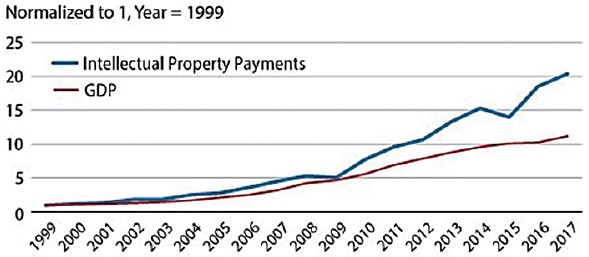
Chart 5 – China: Payments for the use of U.S. intellectual property and GDP. Source: Santacreu, A.M. and Peake M. “A Closer Look at China’s Supposed Misappropriation of U.S. Intellectual Property”, Economic Synopses 2019 n.5, Federal Reserve Bank of St. Louis, February 08.
On the trade side of the confrontation, the negative impact on China’s exports in 2018 has added challenges to keeping growth, even if secondary to the ones we have approached. On technology transfer policies, Chinese authorities may be prepared to offer something meaningful. Given the fact that their ambitions regarding technological breakthrough are now increasingly hinging on local, tacit and idiosyncratic knowledge – see my article on the Autumn issue of Capital Finance International – the Chinese cost-benefit calculation toward finding alternative forms of local technology support may well coax them to reaching some agreement. That would allow them to focus on the domestic challenges of rebalancing without the additional burden of trade confrontation.
Bottom Line
China’s economic growth has been sliding since 2011, while its economic structure has gradually rebalanced toward lower dependence on investments and current-account surpluses. Steadiness in that trajectory has been accompanied by rising levels of domestic private debt, as well as slow progress in rebalancing roles between private and public sectors. In the ongoing trade war, it remains unclear at which growth pace China’s rebalancing will tend to settle. Given China’s weight in the global economy – on trade, investment and financial flows – fingers are crossed in favour of its success in rebalancing.
About the Author
Otaviano Canuto is principal of the Center for Macroeconomics and Development, a senior fellow at the Policy Centre for the New South and a non-resident senior fellow at Brookings Institution. He is a former vice-president and a former executive director at the World Bank, a former executive director at the International Monetary Fund, and a former vice-president at the Inter-American Development Bank. Otaviano has been a regular columnist for CFI.co for the last six years. Follow him on Twitter: @ocanuto
You may have an interest in also reading…

Hydro, Hydro, and Off to Work Go Your Euros — RENAIO has its Game Plan All Worked Out
Unique combination of technology and sustainable asset management. Hydropower is key to accelerating and diversifying the global energy transition —

La Trobe Financial: Unpacking the Rise of Private Markets and Private Credit
Private markets—particularly private credit—have experienced a marked surge in investor interest in recent years. Though this asset class has existed

Singapore: Where the AI Capex Boom Becomes GDP
Singapore’s advance estimate puts second-quarter growth at 5.7 per cent, with manufacturing up 12.2 per cent on what the trade
