Otaviano Canuto, World Bank Group: BRICS Apart as Oil Prices Plunge
The oil price plunge since last June has been deemed, overall, as a boon for the global economy. However, that depends on where one stands as a producer or user, as illustrated here with the divergence of impacts on BRICS economies.
Lower Oil Prices Here to Stay
Brent crude oil prices fell to US$45 a barrel at the end of January, from as high as US$115 in June last year, marking the end of a four-year period of fluctuations in the range of US$93-$118 (Chart 1 – left side). They have recently rebounded to levels close to US$60 but most forecasts point to prices oscillating between $50 and $80 a barrel through 2016.
“Supply-side developments have played a major role. The steady increase of US shale oil production – together with other unconventional oil sources elsewhere – during the long-period of high prices led to a persistent excess of global production over consumption.”
Supply-side developments have played a major role. The steady increase of US shale oil production – together with other unconventional oil sources elsewhere – during the long-period of high prices led to a persistent excess of global production over consumption.
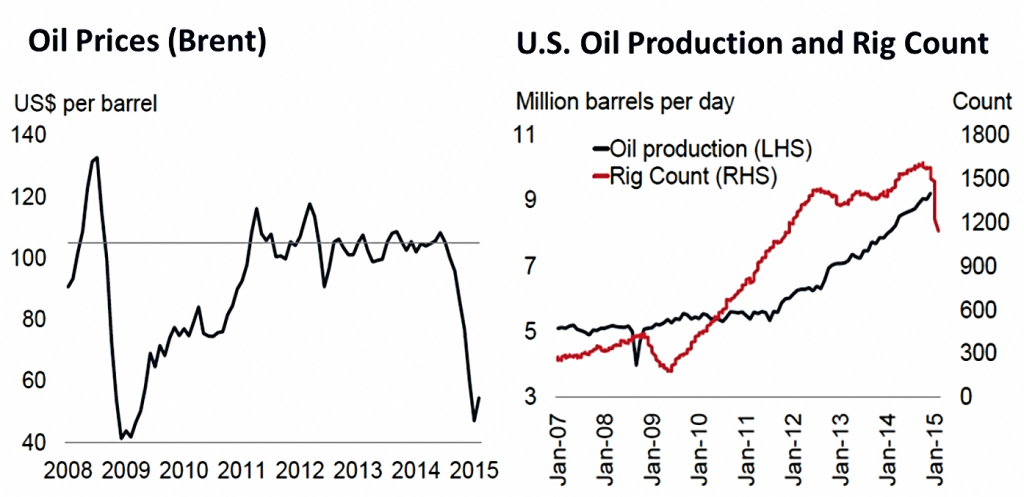
Chart 1: Oil market – recent developments. Source: Baffes et al (2015).
Saudi Arabia, the “swing” global producer, started breaking the previous price-setting norm in August of last year, by discounting prices to Asian consumers to protect market share. In November, the OPEC decision to uphold its production level corresponded to a structural break in oil price formation, in the sense that maintaining market shares clearly superseded targeting any oil price band. Given that shale oil production units can rise or decrease faster than conventional oil, responding to market price fluctuations, the change of the price-setting regime seems to have come to stay for long (Chart 1 – right side).
The Winners and Losers
The overall net impact on global GDP is expected to be positive. Besides a boost to global demand derived from the transfer of purchasing power from oil producers to consumers, lower oil prices have widened the space for (temporary) expansive monetary policies and enabled lower government spending with fuel subsidies.
There have been winners and losers across countries and regions, but negative impacts on the latter are expected to be less globally significant than benefits to the former. According to World Bank estimates: “… a decline in oil prices of about 50 percent could be associated with a 0.7-0.8 percent increase in global GDP over the medium term. (Basu, 2015)”
From a country standpoint in particular, it has all depended on the role and weight of oil production and consumption in its economy. Net exporters (importers) of oil have received a negative (positive) impact from the deterioration (improvement) of terms of trade, accompanied by corresponding income shifts between producers and users within the country – Chart 2 exhibits non-advanced economies as net oil exporters and importers.
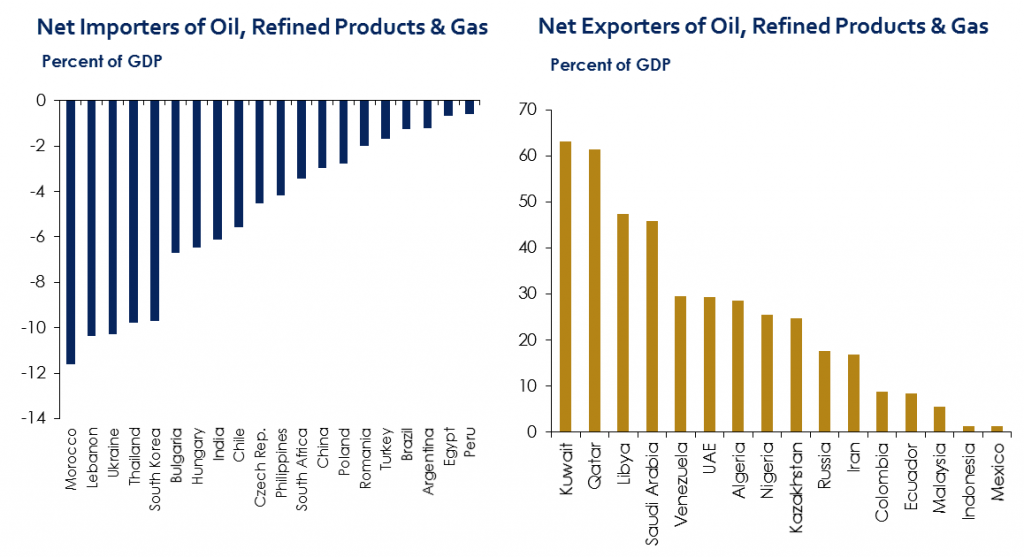
Chart 2: Oil prices – winners and losers. Source: Institute of International Finance (IFF).
Fiscal impacts have been negative where taxes on exports/consumption of oil constitute an important source of government revenues, while positive with respect to outlays with energy subsidies – Chart 3 shows how some countries are fiscally dependent on oil revenues (left side), as well as that fossil fuel subsidies can be found on both net exporter and importer groups of countries (right side). Country-specific contexts and policy responses have also weighed on the final outcome.
The country-specific nature of impacts of lower oil prices can be illustrated with the diversity of situations among the group of BRICS (Brazil, Russia, India, China, and South Africa) economies. Three distinctive positions can be pointed out.
Russia Faces Additional Whammy
As oil and gas account for more than 70% of Russia’s exports and nearly half of its budget revenues (Chart 3), its economy has suffered a strong negative impact from lower oil prices. The energy sector is responsible for 17-25% of its GDP.
The oil price drop has come on top of economic sanctions from the EU, Japan, and the US related to the Ukraine crisis. While current account balances have remained positive, annual resident capital outflows were running at 4-5% of GDP last December.
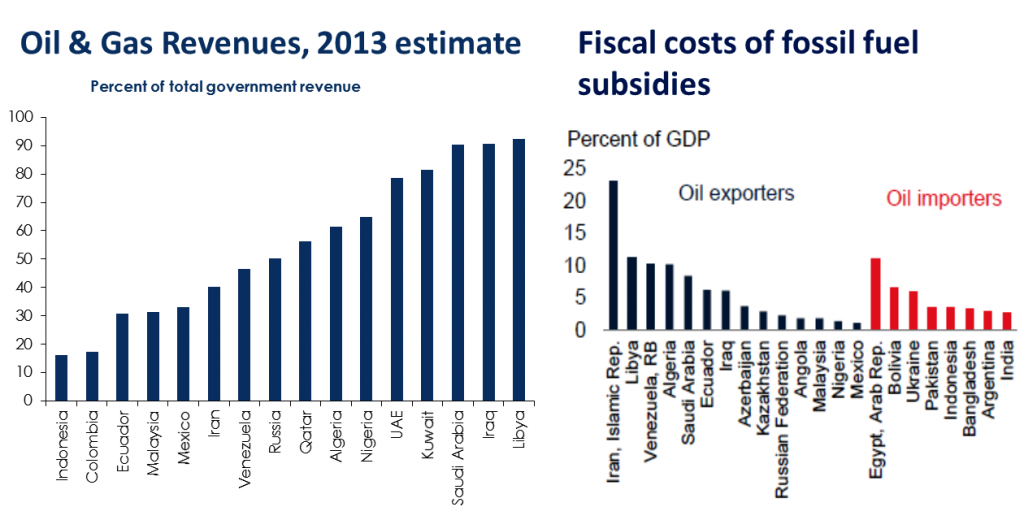
Chart 3: Oil & gas revenues and fiscal costs of subsidies. Sources: IFF (left); Balles et al, 2015 (right).
Devaluation pressures on the rouble stemming from geopolitical risks increased after the oil price fall gathered pace. As a result, not only has annualised inflation moved above 10% this year, but the $600bn foreign debt of Russian banks and non-banking firms – already facing the sanctions bar from refinancing with US and European banks – became an increased source of concern. Although large foreign reserves may still serve as a buffer, real GDP is expected to slump by more than 3.5% this year, followed by another 1.5% in 2016.
China, India, and South Africa Benefit
According to estimates by the World Bank (2015a), a 10% decrease in oil prices is expected to lift growth in oil-importing economies by something in the range of 0.1-0.5 percentage points, depending on the share of oil imports in GDP. Positive fiscal and current-account impacts are also expected. China, India, and South Africa are beneficiaries.
In China, the World Bank estimates an activity-boosting effect of lower oil prices in the range of 0.1-0.2%, given that oil comprises only 18% of energy consumption. A deflationary impact is also on the cards, although it will be limited as energy and transportation correspond to less than 20% of the CPI. Fuel subsidies amount to only 0.1% of GDP, so fiscal impacts will not be significant. On the other hand, as China remains the second-largest world importer, lower oil prices throughout 2015 will likely raise its current account surplus by 0.4-0.7 percentage points of GDP.

Chart 4: Commodity price indices. Source: World Bank (2015).
India has an oil import bill of 7.5% of GDP (Chart 2) and has derived high terms of trade gains from the oil price evolution. Furthermore, its challenges with fiscal deficits and high inflation have been made easier. The government has already taken the opportunity to phase out diesel subsidies and hike taxes on oil derivatives. Falling oil prices have also helped to bring inflation down to less than 4.5% a year last December, opening space for some monetary policy loosening ahead.
South Africa is also a net importer of oil and a beneficiary from lower prices, including by corresponding effects on inflation and the import bill (Chart 2). As far as current-account deficits and GDP are concerned, recent oil price developments have come as a relief after the previous decline of prices of metals and minerals – see Chart 4 – that comprise a substantial chunk of the country’s exports and GDP.
Mixed Impact on Brazil
Brazil has a small deficit on its oil foreign trade – as compared to the countries above (Chart 2) – and that qualifies it for potential benefits of declining prices both on its current-account deficit and as a facilitator for an undergoing domestic price realignment of oil derivatives. On the other hand, the new international price regime and levels have come at a moment in which strong bets on future oil-related investments had been made in previous years, toward an expected crossing of the threshold to the group of net-exporting countries. Together with the unfolding corruption scandals in state-controlled Petrobrás, world oil price developments have prompted a full downward review of such investments.
Price Plunge Brings Opportunity
Those oil-exporting countries that prepared themselves for the downward phase of the price cycle, constituting fiscal, and international reserve buffers during good times, have been able to cope better with the new scenario. For all the others, besides realising what a high premium must be attached to diversifying the economy from an excessive dependence on a single commodity, there is the template for future upward cycle phases left by those successful hoarders.
Finally, across the whole range of countries, the current oil price phase constitutes an opportunity to suppress existing distortive fossil-fuel subsidies. As argued by Basu and Indrawati (2015), government expenditures with fuel subsidies should be reallocated to effective pro-poor policies. If that is accompanied by some sort of carbon taxation, cleaner energies may keep their development.
About the Author
 Otaviano Canuto is Senior Advisor on BRICS Economies in the Development Economics Department, World Bank, a new position established by President Kim to bring a fresh research focus to this increasingly critical area. He previously served as the Bank’s Vice President and Head of the Poverty Reduction Network (PREM), a division of more than 700 economists and other professionals working on economic policy, poverty reduction, gender equality and analytic work for client countries. He also served as an Executive Director of the Board of the World Bank from 2004-2007. Outside of the Bank he has held leadership positions at the Inter-American Development Bank where he was Vice President for Countries, and for the Government of Brazil where he was Secretary for International Affairs at the Ministry of Finance. He also has an extensive academic background, serving as Professor of Economics at the University of São Paulo and University of Campinas (UNICAMP) in Brazil.
The opinions expressed here are the author’s and should not be attributed to the World Bank.
Follow Otaviano Canuto on Twitter: www.twitter.com/ocanuto
References
Baffes, J et al, 2015. The Great Plunge in Oil Prices – Causes, Consequences, and Policy Responses, World Bank, Policy Research Note No.1, March.
Basu, K. 2015. Oil Price Plunge holds promise and peril, Let’s Talk Development, March 3.
Basu, K. and Indrawati, S.M. 2015. Cheap oil for change, Project Syndicate, February 9.
World Bank, 2015a. Global Economic Prospects, January.
World Bank, 2015b. Commodity Markets Outlook, January.
You may have an interest in also reading…
Nigeria: An Economic Upswing Foretold
Oil prices have rebounded from their recent lows and may yet provide temporary relief to Nigeria, allowing the incoming administration
European Council’s President, Herman Van Rompuy: Unlocking Opportunities for Growth and Competitiveness
“Unlocking opportunities for growth and competitiveness” Keynote opening speech by President of the European Council Herman Van Rompuy at the
Book Review: Squeezing Cash Out of Milliseconds
Time is money. To high-frequency traders, it means big money. HFTs make cash by being milliseconds faster than the other


