


[vc_row][vc_column width=”1/2″][vc_column_text]
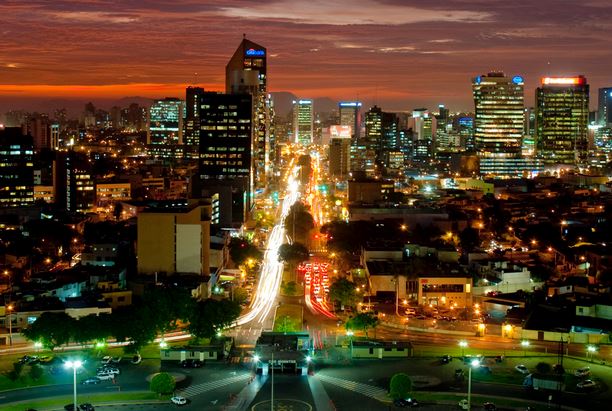
Peru

Peru was the 49th largest economy in the world by nominal GDP in 2018. Its GDP per capita was $6,947 USD. Peru is the world's second largest producer of silver and copper. It was ranked 72nd in the World Bank's Human Capital Index and 81st in the Economic Complexity Index in 2017. It is a member of the regional trading group Mercosur. Services was the largest economic sector in 2017 (54 percent of GDP), followed by manufacturing (12.8 percent), and agriculture (6.7 percent). In 2017, the largest export sectors were minerals (42.38 percent), agriculture (19.58 percent), services (13.84 percent), and stones (10.67 percent). The largest individual exports were copper ore (24.15 percent), gold (9.52 percent), travel and tourism (7.33 percent), refined petroleum (5.17 percent), and zinc (4.34 percent). Its largest export partners were China (28.5 percent), the USA (14.59 percent), and Spain (5.34 percent). The largest goods imports were refined petroleum (7.31 percent), crude oil (5.94 percent), cars (4.28 percent), and transmission apparatus for radio, telephones, and television (3.51 percent). Peru declared independence in 1821 after pressure from Buenos Aires with loyalists finally defeated in 1824. Between 1840 and 1870, the economy boomed because of the discovery of guano (fertiliser from bird-droppings). But by the end of the boom the government was under fiscal pressure, which was compounded by the "War of the Pacific" with Chile between 1879 and 1884. Following the war and up until the Great Depression, a commodity boom and administrative and macroeconomic reforms led to strong economic growth and diversification. Free trade in the 1950s gave way to import substitution in the 1960s as the population grew and migrated to the larger cities on the coast. In 1968, the military took power. They nationalised several industries and increased state intervention but heavy borrowing and the 1970s oil price shocks led to high public debt and hyper-inflation by the 1980s. In the 1990s, stabilisation policies and trade liberalisation led to strong growth which continued in the 2000s with the help of a global commodities boom and accompanying FDI in the mining industry.
[/vc_column_text][vc_column_text] Its population in 2018 was 32,551,815 [1]
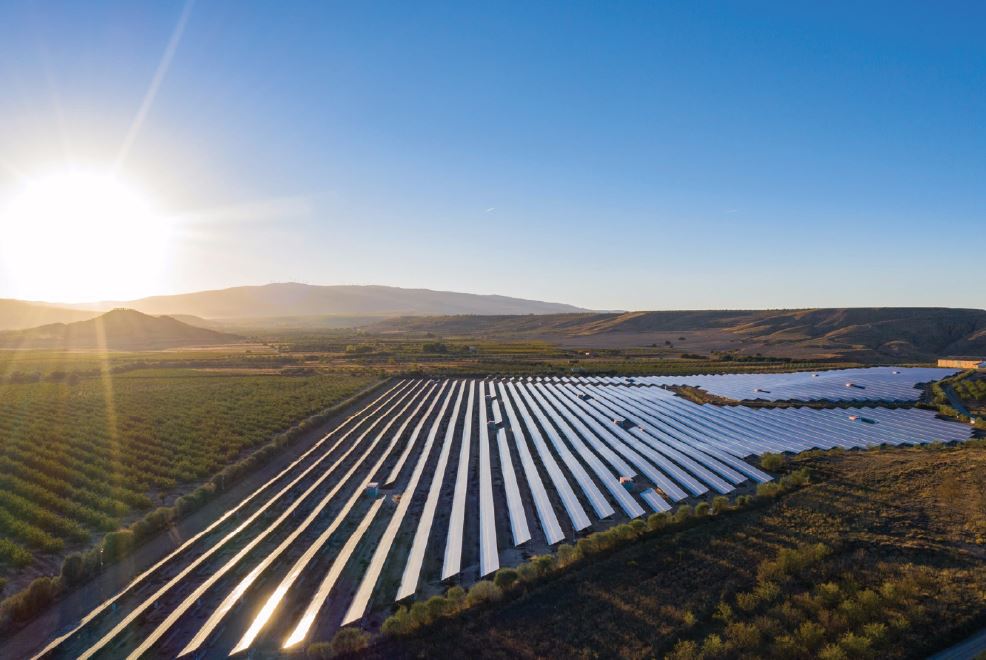
 In 2015, 25.50% of its total energy
consumption was renewable [2]
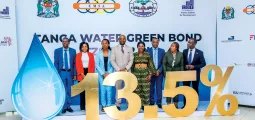
 In 2021, its GDP grew by 13.35% [2]
 In 2021 it had a negative Current
Account Balance of US$bn 6.19 [3]
 Its unemployment rate in 2021 was 10.90% [3]
 Its Expenditure on R&D (as a percentage of
GDP) in 2020 was 0.17% [2]
 A Big Mac will set you back the
local equivalent of US$3.14 [4]
What free trade areas or economic unions is it a member of?
Member of the Andean Community (ANDEAN) since 26/05/1969
Other members:
What trade deals are there between Andean Community and other countries and economic unions?
MERCOSUR - CAN free trade area (from 31/12/2003)
Member of the Comprehensive and Progressive Agreement for Trans-Pacific Partnership (CPTPP) since 30/12/2018
Other members:
Australia, Brunei Darussalam, Canada, Chile, Japan, Malaysia, Mexico, New Zealand, Singapore, Vietnam
What trade deals are there between Comprehensive and Progressive Agreement for Trans-Pacific Partnership and other countries and economic unions?
None
[/vc_column_text][vc_column_text]What trade deals are there with other countries and economic unions?
Protocol on Trade Negotiations (from 11/02/1973)
United States - Peru free trade agreement (from 01/02/2009)
Peru - Chile free trade agreement (from 01/03/2009)
Canada - Peru free trade agreement (from 01/08/2009)
Peru - Singapore free trade agreement (from 01/08/2009)
Peru - China free trade agreement (from 01/03/2010)
Peru - Korea, Republic of free trade agreement (from 01/08/2011)
Peru - Mexico free trade agreement (from 01/02/2012)
Japan - Peru free trade agreement (from 01/03/2012)
Panama - Peru free trade agreement (from 01/05/2012)
EFTA - Peru Free Trade Agreement (from 01/07/2012)
Costa Rica - Peru free trade agreement (from 01/06/2013)
Pacific Alliance free trade agreement (from 01/05/2016)
Peru - Honduras free trade agreement (from 01/01/2017)
Peru - Australia free trade agreement (from 11/02/2020)
UK - Andean countries trade agreement (from 01/01/2021)
[/vc_column_text][/vc_column][vc_column width=”1/2″][vc_column_text]
Know the Risks and ‘See’ the Future with the Integrity and Transparency of Moody’s Local
Grupo T-Solar – The Generation Game: In 2020, That Means CSR, Environment, Efficiency and Opportunities for All Employees

Book Review: The Neighborhood by Mario Vargas Llosa
Energy Case Study: Peru

Hernando de Soto: Unlocking the Riches of the Poor

DEG: Germany Eyes Future Markets Beyond the BRICS
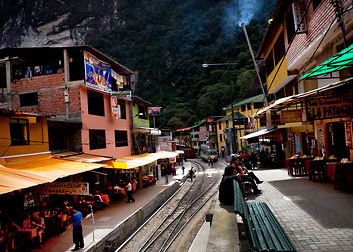
Learning the Ropes in Peru: Chinese Companies Engage Local Communities
IFC – International Finance Corporation: Eliminating Poverty, One Loan at a Time
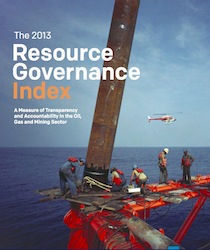
Revenue Watch: 4 out of 5 Companies Fail in Good Governance
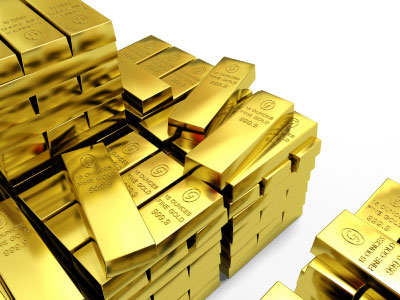
Gold Becomes Peru’s Main Export Item in the First Quarter of 2012
Trade with the United Kingdom
Source: UK Office for National Statistics, October 2022.
Contains public sector information licensed under the Open Government Licence v3.0.
Loading, Please Wait!
This may take a second or two.